Dr. Rob Dillon, Coordinator


Monday, March 28, 2022

No reproductive isolation between Lithasia populations of the duttoniana and jayana forms in the Duck River, Tennessee

Editor’s Notes - We have always tried to avoid excessively technical posts on the FWGNA blog.  I typically publish formal research results elsewhere first and subsequently refer to those results here in a more casual tone.  Two of the three essays I have posted in recent months about the Lithasia of the Duck River [7Dec21] and [4Jan22] were, for example, preceded by brief, technical notes published in Ellipsaria (the newsletter of the Freshwater Mollusk Conservation Society) in 2020.

The post that follows, however, is technical.  Its publication was suppressed by FMCS Newsletter editor Dr. John Jenkinson because one of our mutual colleagues on the FMCS Board [1] called to Dr. Jenkinson’s attention that Ellipsaria content is being indexed by Google Scholar, and hence that the hypotheses I have proposed below [2] might fall upon naïve and uncritical eyes.  This essay was ultimately published as: Dillon, R.T., Jr. (2023b)  No reproductive isolation between Lithasia populations of the duttoniana and jayana forms in the Duck River, Tennessee.  Pp 175 – 182 in The Freshwater Gastropods of North America Volume 6, Yankees at The Gap, and Other EssaysFWGNA Project, Charleston, SC 

The taxonomic history of the pleurocerid genus Lithasia (Haldeman 1840) is a long and complicated one.  Goodrich (1940) recognized 16 taxa of Lithasia with smooth shells, 3 with tuberculate shells, and 5 taxa bearing shells with spines or acute protuberances.  This last category comprised Lithasia duttoniana, described by Lea (1841) from the Duck River, L. jayana, also described by Lea (1841) from Caney Fork (of the Cumberland), and three subspecies of L. armigera, described by Say (1821) from the Ohio River.

Goodrich considered both Lithasia jayana, a heavily-shelled species bearing two rows of spines, and Lithasia duttoniana, a more lightly-shelled species typically bearing (at most) a single row of small protuberances, endemic to the rivers from which they were described.  Lithasia armigera, as understood by Goodrich, ranged from the lower Ohio and Wabash Rivers through most of the Cumberland River and much of the Tennessee River as well.

In an unpublished report to the U.S. Fish and Wildlife Service, Davis (1974) suggested that Lithasia be subsumed under the genus Io of Isaac Lea (1831).  Davis then went on to recognize three smooth-shelled taxa in the Duck River, which do not concern us here, and two spiny taxa, which he identified as Io armigera duttoniana and Io armigera jayana.  After a period of comment and revision, Davis’ spiny taxa were offered for review under the Endangered Species Act in the Federal Register (May 22, 1984) as Lithasia duttoniana and Lithasia jayana.

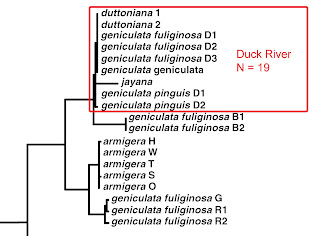
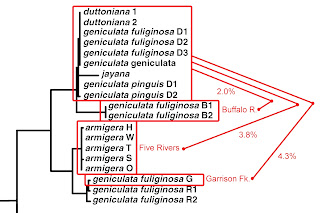
Minton & Lydeard (2003) surveyed mitochondrial CO1 sequence variation in Lithasia populations from the Duck River and many other river systems of the American southeast. The 4 unique sequences they obtained from 19 Duck River snails (1 jayana, 4 duttoniana, and 14 of smooth-shelled taxa, in 9 Genebank submissions) did not resolve into consistent clades.  Thus Minton & Lydeard synonymized all Duck River populations, bearing both smooth and spiny shells, under a single smooth-shelled nomen, L. geniculata (Haldeman 1840).

Dillon (2020 b, c) has recently reported, however, a survey of allozyme variation in Duck River Lithasia confirming Goodrich’s (1940) hypothesis that populations of the spiny duttoniana form are reproductively isolated from the more smooth-shelled form, which Dillon followed Goodrich in identifying as Lithasia geniculata.

The large and diverse samples of Lithasia analyzed by Dillon (2020 b, c) were collected incidentally during a survey of the Duck River mussel fauna conducted by Ahlstedt et al. (2017).  In addition to populations bearing shells of the (smooth-shelled) geniculata form and the lighter, single-spined duttoniana form, the collections made by Ahlstedt and colleagues at two of their most downstream sites also contained Lithasia bearing shells of the heavy, doubly-spined jayana form.  Here I compare those doubly-spined jayana samples to sympatric samples of the lightly-shelled duttoniana form using gene frequencies three allozyme-encoding loci.

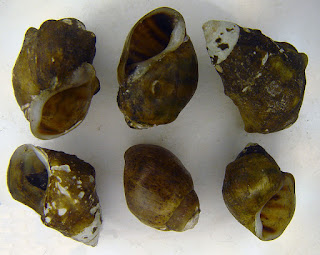
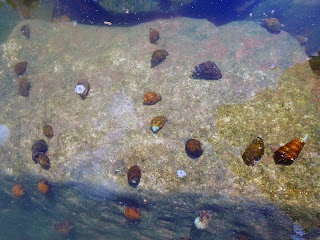
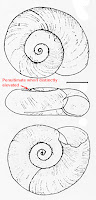
Fig. 1. The Duck River, showing sample sites.

My methodology for the resolution of allozyme polymorphism by horizontal starch gel electrophoresis has been previously detailed (Dillon 1982, 1985, 1992).  For the present study, variation interpretable as the product of codominant, Mendelian alleles was resolved at the mannose phosphate isomerase (Mpi) locus using buffers TrisCit6 and TEB8, at the octopine dehydrogenase (Odh) locus using buffers TisCit6 and Poulik, and hexanol dehydrogenase (hexdh) using buffers TEB8 and Poulik.

Sample sites and example shells are shown in Figure 1 above.  (The shell length of dutF is 24.6 mm; the other shells are to scale.)  At their most downstream site, site F, Ahlstedt and colleagues collected 35 Lithasia of the duttoniana form (dutF) and 30 of the jayana form (jayF).  This site, the Watered Hollow Boat launch at Duck River Mile 26.0 (35.9322, -87.7475), was the point at which Minton & Lydeard (2003) collected their sample of L. jayana for mtDNA sequencing.  Upstream at Wright Bend Site E (TNC110, DRM 38.7, 35.8267, -87.6657), Ahlstedt collected 44 Lithasia of the duttoniana form (dutE) and 40 of the jayana form (jayE).

Lithasia bearing shells of the jayana morphology become increasingly rare further upstream and are not effectively collectable above Duck River mile 60.  But populations of the more lightly-shelled duttoniana type extend as far upstream as DRM 186.  Gene frequencies in duttoniana population dutD, collected from the Fountain Creek confluence at DRM 145.5 (TNC 94, 35.5695, -86.9682), are included here for comparison.

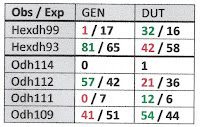
Table 1 below shows that no significant allele frequency differences were apparent between samples bearing shells of the duttoniana and jayana forms at either site where they co-occurred.  This was true for the Odh locus (chi-square = 0.688, 2 df at site E, chi-square = 1.62, 3 df at site F), the Mpi locus (Fisher’s p = 0.334 at site F) and the Hexdh locus (Fisher’s p = 0.513 at site E, p = 0.832 at site F).  Judging by Nei (1978) genetic distance, sample jayE was more genetically similar to sample dutE (D = 0.050), and sample jayF was more similar to dutF (D = 0.080) than jayE was to jayF (D = 0.161) or dutE to dutF (D = 0.164).

Gene frequency differences were very significant longitudinally, however, at two of the three loci examined.  Combining the 44 + 40 = 84 samples from site E (DRM 38.7) and comparing to the 35 + 30 = 65 samples from site F (DRM 26.0), chi-square = 26.2 (3 df, p < 0.00001) at the Odh locus and chi-square = 9.91 (1 df, p = 0.002) at the Hexdh locus.  The dutD sample collected upstream at DRM 145.5 also differed significantly at the Odh locus from the combined site E sample (chi-square = 7.84, 2df, p = 0.02).

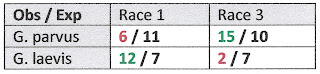
Tab 1. Gene frequencies at three loci in five samples of Lithasia.

These results reflect no evidence of reproductive isolation between Lithasia bearing the duttoniana shell morphology and those bearing the jayana shell morphology.  The genetic evidence is strong, however, for isolation by distance among the spiny Lithasia populations down this length of river, similar in magnitude to that documented by Whelan et al. (2019) in Alabama Leptoxis, and Dillon (2020a) in North Carolina Pleurocera.

The similarity between these results and those previously published by Dillon (2020b) for the smooth-shelled Lithasia of the Duck River is striking.  Dillon confirmed the hypothesis of Goodrich (1934) that the shells borne by Duck River Lithasia geniculata also become more robust when sampled in a downstream direction, adding bumpy shoulders to the point that 19th-century authorities recognized two additional species, L. fuliginosa and L. pinguis.  Here an identical phenomenon is documented in the spiny Lithasia, populations identified by Goodrich as Lithasia duttoniana developing such robust and heavy shell spines downstream that some authorities have recognized a second species, L. jayana.

Given such levels of shell variability, neither nominal Lithasia duttoniana (Lea 1841) nor Lithasia jayana (Lea 1841) can be distinguished at the specific level from the much more broadly-distributed Lithasia armigera (Say 1821).  The suggestion of Davis (1974) that both of Lea’s 1841 nomina be lowered to subspecific status under Say’s L. armigera would seem to have substantial merit.


References

Ahlstedt, S. A., J. R. Powell, R. S. Butler, M. T. Fagg, D. W. Hubbs, S. F. Novak, S. R. Palmer and P. D. Johnson. 2017. Historical and current examination of freshwater mussels (Bivalvia: Margaritiferidae: Unionidae) in the Duck River basin Tennessee, USA. Malacological Review 45:1-163.

Davis, G.M. 1974.  Report on the rare and endangered status of a selected number of freshwater Gastropoda from southeastern U.S.A. U.S. Fish & Wildlife Service. Washington, DC. 51 p.

Dillon, R. T., Jr. 1982. The correlates of divergence in isolated populations of the freshwater snail, Goniobasis proxima (Say). Ph.D. Dissertation, The University of Pennsylvania.

Dillon, R. T., Jr. 1985. Correspondence between the buffer systems suitable for electrophoretic resolution of bivalve and gastropod isozymes. Comparative Biochemistry and Physiology 82B: 643-645. [pdf]

Dillon, R. T., Jr. 1992. Electrophoresis IV, nuts and bolts. World Aquaculture 23(2):48-51.

Dillon, R. T., Jr. 2020a. Fine scale genetic variation in a population of freshwater snails. Ellipsaria 22(1): 24-25. [pdf]

Dillon, R. T., Jr. 2020b. Population genetic survey of Lithasia geniculata in the Duck River, Tennessee. Ellipsaria 22(2):19 – 21. [pdf]

Dillon, R. T., Jr. 2020c. Reproductive isolation between Lithasia populations of the geniculata and duttoniana forms in the Duck River, Tennessee. Ellipsaria 22(3): 6 – 8. [pdf]

Goodrich, C. 1934. Studies of the gastropod family Pleuroceridae - I. Occasional Papers of the Museum of Zoology, University of Michigan 286:1-17.

Goodrich, C. 1940. The Pleuroceridae of the Ohio River drainage system. Occasional Papers of the Museum of Zoology, University of Michigan 417:1 - 21.

Minton, R. L. and C. Lydeard. 2003. Phylogeny, taxonomy, genetics, and global heritage ranks of an imperiled, freshwater snail genus Lithasia (Pleuroceridae). Molecular Ecology 12:75-87.

Nei, M. 1978 Estimation of average heterozygosity and genetic distance from a small number of individuals. Genetics 89:583–590.

Whelan, N. V, M. P. Galaska, B. N. Sipley, J. M. Weber, P. D. Johnson, K. M. Halanych and B. S. Helms. 2019. Riverscape genetic variation, migration patterns, and morphological variation of the threatened Round Rocksnail, Leptoxis ampla. Molecular Ecology 28:1593-1610.


Notes

[1] Here is the relevant passage from the minutes of the FMCS Board, November 19, 2020:

“Nathan Whelan noticed recently that some Contributed Articles in Ellipsaria are now findable on Google Scholar. This was unexpected for our informal, non-peer-reviewed newsletter.  Nathan also recognized that some recent articles in the newsletter include the analysis of data and/or what could be viewed as proposed taxonomic revisions. In a series of emails, monitored and, occasionally, participated in by the Executive Committee, Nathan and Ellipsaria Editor John Jenkinson agreed that articles including data analysis and/or taxonomic revisions should be peer-reviewed and, therefore, are outside of the intended scope and purpose of our newsletter.”

[2] Science is the construction of testable hypotheses about the natural world.  It is not the handing down of fact.  It appeals to no authority, nor does it merit any.  It is independent of context or culture.  Whether published in a slick international journal or a humble newsletter is irrelevant.  The quality of a work of science is dependent only upon the extent to which the hypothesis proposed matches the natural world, upon rigorous test.  And it stuns me – literally stuns me – to see how few scientists actually understand any of this.

Thursday, March 3, 2022

The third-most amazing research results ever published for the genetics of a freshwater gastropod population [1]. And the fourth-most amazing, too.

Editor's Notes - This is the third installment of what will turn out to be a five-part series on the Lithasia of the Duck River in Middle Tennessee.  It will help to familiarize yourself with my posts of [7Dec21] and [4Jan22] before continuing. This essay was subsequently published as: Dillon, R.T., Jr. (2023b)  The third-most amazing research results ever published for the genetics of a freshwater gastropod population, and the fourth-most amazing, too.  Pp 163 – 173 in The Freshwater Gastropods of North America Volume 6, Yankees at The Gap, and Other EssaysFWGNA Project, Charleston, SC.

In 2003, Russ Minton and Chuck Lydeard published a CO1 gene tree for the North American pleurocerid genus Lithasia in Molecular Ecology [2].  Nestled among the branches of that tree was the third-most amazing research result in the history of freshwater gastropod population genetics.  What Minton and Lydeard found was… nothing.

The Minton & Lydeard study was very good by the standards of its day.  Our colleagues did a thorough job collecting U1S2NMT3 individuals [7] from 30 Lithasia populations representing 11 nominal species and subspecies.  We first touched on the M&L results back in [4Sept19], focusing on a single outside branch, labeled “L. geniculata pinguis.”  And here is a quote from that 2019 essay: “To completely unpack the message being telegraphed to us by the enigmatic arboreal specimen (of Minton and Lydeard) would require at least 6 – 8 blog posts of standard length.”  So, what follows is another installment [8].

Minton & Lydeard included in their analysis 19 Lithasia individuals from the main Duck River, identified as follows: 6 geniculata pinguis, 7 geniculata fuliginosa (from three sites), 1 geniculata geniculata, 4 duttoniana (from two sites), and 1 jayana.  And on the basis of mtCO1 sequence, they were unable to distinguish among any of those 19 individuals.  I was agog in 2003 and remain agog 20 years later.

Detail from Minton & Lydeard [2] fig 4, modified

To contextualize.  With no difficulty whatsoever, even at very small sample sizes, workers have easily been able to document 23% CO1 sequence divergence within Pleurocera simplex populations, 21% within Pleurocera catenaria, 19% within Pleurocera proxima, 15% within Leptoxis carinata, and 12% within L. ampla [9].  Then In 2003, in the pages of an international journal, Russ Minton and Chuck Lydeard stunned the world by reporting no more than a couple lousy nucleotides of difference in 19 individual Lithasia sampled down the 200-mile length of the Duck River, bearing five different Latinate nomina.

Well, maybe the M&L result is not terribly surprising for the 14 individual Duck River Lithasia geniculata they included in their survey, of the three subspecies.  In December [7Dec21], we documented evidence of gene flow among subpopulations representing all three of those nomina, attenuated by distance but not much else [11].  The M&L pinguis sample seems to have been sampled from below the falls.

Nor am I terribly shocked by the absence of sequence divergence among the 4 duttoniana sampled by M&L.  In January [4Jan22] we documented similar levels of isolation-by-distance between Duck River subpopulations bearing the DUT shell morphology that we had previously seen in the GEN form [12].

Nor am I even terribly surprised by the absence of sequence divergence between the 4 duttoniana and the singleton snail that M&L identified as “Lithasia jayana.”  This is the first time the specific nomen “jayana” has appeared on the FWGNA blog.  It will not be the last.  We will have much more to say about Lithasia jayana in posts upcoming.  But for now, please accept that there is no significant genetic difference between snails that have been identified as L. jayana on the basis of shell morphology and sympatric Lithasia populations that Goodrich, Minton, and everybody else has always called L. duttoniana.

Rather, the third-most amazing research result ever registered in the annals of freshwater gastropod population genetics is the absence of any detectable sequence divergence between the 14 individual geniculata (all subspecies) and the 5 individual duttoniana + jayana.  Populations historically identified by those two sets of nomina really are morphologically distinct throughout their entire 100+ miles of sympatry in the Duck River, and everywhere else through their combined ranges across the Ohio, Cumberland, and Tennessee.

Can you tell us apart? [13]

Isaac Lea and George Tryon and Calvin Goodrich and all modern workers even unto the present day have all drawn a clear and unambiguous distinction between Lithasia populations bearing a robust, oblong, bumpy shell morphology and those bearing a more acutely-spired shell morphology, with angular whorls often tuberculate or even slightly-spiny.  In our January essay we abbreviated that former morphology “GEN” and that latter morphology “DUT.”  Snails bearing shells of the DUT morphology range only up to around Duck River mile 186 (as opposed to 275 for GEN) and seem more common in the shallows, rather than on rocks in the middle.  No prior worker has ever questioned the distinction between those two groups of taxa.

Setting 200 years of field observation aside, however.  On the basis of their sequence data, Minton and Lydeard synonymized all the Duck River Lithasia taxa: pinguis, fuliginosa, duttoniana, and jayana, under Haldeman’s (1840) geniculata.  Russ Minton then went on, in papers published in 2008 and again in 2018, to perform detailed morphometric analyses on the entire five-taxon GEN/DUT mishmash combined [14].  Bless his heart.

Well, the GEN and DUT populations do differ genetically, but not by much.  When Johnson, Ahlstedt, and their colleagues sent me those Lithasia samples from Fountain Creek (site D), Wright Bend (site E) and Watered Hollow (site F) back in 2002, they divided them (quite naturally and conventionally) into oblong-bumpy subsamples they identified as Lithasia geniculata, and acute-angular subsamples they identified as Lithasia duttoniana.  And in my January essay [4Jan22] I used the allozyme results I obtained from Wright Bend (site E) as an example of stable character phase disequilibrium between GEN and DUT.  Results were the same at Fountain Creek and Watered Hollow.  Hit this link for a pdf of my technical results [Ellipsaria 22(3)].

Lithasia bearing the GEN shell morphology and Lithasia bearing the DUT morphology sympatric in the Duck River do not constitute a single randomly-breeding population.  There is some sort of reproductive isolation between them [15].  They are distinct biological species.

How many species can you see? Click to zoom [16].

But my goodness, the allozyme divergence between GEN and DUT is tiny!  The gene frequencies I published in Table 1 of my paper in Ellipsaria 22(3) were certified in 2020 as the fourth-most amazing research results in the history of freshwater gastropod population genetics, at 88.7 international amazingness units [1].

Again, some context would seem to be in order.  I ran allozyme gels on scores of pleurocerid populations during the 35 years I had access to a biochemical laboratory, 1980 – 2016.  Typically, I would do an initial screening across 15 – 20 allozyme loci (17 in the case of the Duck River Lithasia), and then focus on the polymorphic loci for a detailed analysis.  And very rarely did I ever find a pair of distinct biological species sharing alleles any more than at a couple loci, out of 15 or 20 [17].

Even among populations within pleurocerid species, fixed allozyme differences are not uncommon [18].  Across the 25 populations of P. proxima I surveyed for my 1984 dissertation, for example, it was possible to find conspecific populations sharing no alleles at five loci.  And even within individual pleurocerid populations, sampled from single creeks or rivers, significant allozyme differences among subpopulations are not uncommon, as we witnessed in the P. proxima of Naked Creek in October [12Oct21], and in the L. geniculata of the Duck in December [7Dec21].

So seen in that context, to find no difference between a pair of reproductively-isolated pleurocerid species at 14 of 17 allozyme loci, and merely-statistical differences at the other three, shocked me back in 2002.  And I’m obviously still not over it, any more than I am over the CO1 sequence results published by Minton and Lydeard in 2003.  I was aghast at the time and remain aghast to this day.

Let this be a lesson to any of you high school seniors out there, looking for science fair projects.  There are a lot of online purveyors of simple kits advertising “DNA barcoding” services, promising to identify any sort of unknown bug or slug you might pluck into a tube and mail to Canada.  That’s fun, and I’m sure you’ll learn more from the experience than lying around your bedroom, watching Tik-Tok videos.  But please understand that no serious scientist would ever publish a paper in the peer-reviewed literature relying on “DNA barcoding.”

Do I have time to touch on one additional feature of the 2003 M&L gene tree before you run out of patience with me this month?  Notice this.  Not only is there essentially zero divergence among their 19 Duck River samples of two reproductively-isolated species, we really don’t see much sequence divergence anywhere in the entire top half of the Minton & Lydeard Lithasia tree.

Detail from Minton & Lydeard [2] fig 4, modified.

If you back down one limb below the big Duck River cluster at the top, you’ll see a couple samples labeled, “geniculata fuliginosa” from 23 miles back up a tributary of the lower Duck River called the Buffalo.  M&L did uncover 2.0% sequence divergence between their Duck River N = 19 and their Buffalo River N = 2, upon which basis Russ described a new species, “Lithasia bubala” in 2013 [19].  The allozyme data I reported on [7Dec21] did not support that [11].

Then if you back down two limbs from the M&L Duck River cluster, you find a set of five sequences identified as Lithasia armigera.  These represent 14 individuals collected from five far-flung rivers: the Harpeth River and the Stones River (both tributaries of the Cumberland), the main Tennessee River way down in Alabama, the Wabash River (in Illinois) and the main Ohio River on the IL/KY border.  All 14 of these snails, from five populations, were genetically indistinguishable.  And all differed by just 3.8% from the Duck River group.

And if you back down three limbs from the M&L Duck River cluster, you’ll find a set of three sequences (representing 8 individuals) labelled “geniculata fuliginosa,” two from the Red River (a tributary of the Cumberland about 80 miles north of the Duck) and one sequence from Garrison Fork, an upstream tributary of the Duck River itself.  The sequence divergence between that set of N = 8 and the set of N = 19 from the main Duck was 4.3%.

Let me say that again.  There is less sequence divergence between L. duttoniana of the Duck River and L. armigera of the Wabash River almost 200 miles away, than between L. geniculata fuliginosa of the Duck River and L. geniculata fuliginosa of Garrison Fork, 25 miles upstream.  What in the world does that mean?  Stay tuned!


Notes

[1] I apologize for the overly-dramatic title.  For the record, the CO1 sequence homogeneity in the Duck River Lithasia as reported by Minton & Lydeard in 2003 [2] scored 91.5 international amazingness units.  The Bianchi et al. (1994) report of hybridization between P. virginica and P. semicarinata livescens [3] holds first place in the freshwater gastropod population genetics division at 93.2 international amazingness units, with Nathan Whelan’s [4] discovery of a wildebeest sequence in the population of bison he sampled at Shades Creek in second place at 91.9 iau.

For context, in the freshwater gastropod transmission genetics division, Yoichi Yusa’s discovery of multigenic sex determination in Pomacea [5] scored a whopping 98.7 iau in 2007, pushing  Boycott’s (1923) paper on maternal inheritance of chirality in Lymnaea [6] to second all time, at 98.4 iau.

[2] Minton, R. L. and C. Lydeard. 2003. Phylogeny, taxonomy, genetics, and global heritage ranks of an imperiled, freshwater snail genus Lithasia (Pleuroceridae). Molecular Ecology 12:75-87.

[3] Bianchi, T. S., G. M. Davis, and D. Strayer 1994.  An apparent hybrid zone between freshwater gastropod species Elimia livescens and E. virginica (Gastropoda: Pleuroceridae).  Am. Malac. Bull. 11: 73 - 78.

[4] Whelan, N.V. & E. E. Strong (2016)  Morphology, molecules and taxonomy: extreme incongruence in pleurocerids (Gastropoda, Cerithiodea, Pleuroceridae). Zoologica Scripta 45: 62 – 87.  I reviewed Nathan’s findings in a series of posts back in 2016, see note [10] below.

[5] Yusa, Y. 2007. Nuclear sex-determining genes cause large sex-ratio variation in the apple snail Pomacea canaliculata. Genetics 175: 179-184.  For more, see:

  • Ampullariids star at Asilomar [11Aug05]

[6] Boycott, A.E. and C. Diver (1923) On the inheritance of sinistrality in Limnaea peregra.  Proceedings of the Royal Society of London, Series B, Biological Sciences 95: 207 – 213.

[7] Usually 1, Sometimes 2, Never More Than 3.  This has always been the rule-of-thumb in sampling for gene trees.  See:

  • The Lymnaeidae 2012: Stagnalis yardstick [4June12]

[8] Actually, looking back on this post from the bottom, I am afraid I have written an essay of twice what ought to be my standard length.  And this is two installments.  Sorry.

[9] I coined the term “mitochondrial superheterogeneity” on this blog in 2016 to describe double-digit intrapopulation sequence divergence [10].  Here are several prominent examples from the pleurocerids:

  • Dillon, R. T., and R. C. Frankis. (2004)  High levels of DNA sequence divergence in isolated populations of the freshwater snail, Goniobasis.  American Malacological Bulletin 19: 69 - 77.  [PDF]
  • Lee, T., J. J. Kim, H. C. Hong, J. B. Burch, and D. O’Foighil (2006)  Crossing the Continental divide: the Columbia drainages species Juga hemphilli is a cryptic member of the eastern North American genus Elimia.  J. Moll. Stud. 72: 314-317. 
  • Dillon, R T. and J. D. Robinson (2009)  The snails the dinosaurs saw: Are the pleurocerid populations of the Older Appalachians a relict of the Paleozoic Era?  Journal of the North American Benthological Society 28: 1 - 11. [PDF]
  • Dillon, R. T. Jr, and J. D. Robinson (2016)  The hazards of DNA barcoding, as illustrated by the pleurocerid gastropods of East Tennessee.  Ellipsaria 18: 22-24. [PDF]
  • Whelan, N.V. & E. E. Strong (2016)  Morphology, molecules and taxonomy: extreme incongruence in pleurocerids (Gastropoda, Cerithiodea, Pleuroceridae). Zoologica Scripta 45: 62 – 87.

[10] For more about the origin and significance of the phenomenon, see:

  • Mitochondrial superheterogeneity: What we know [15Mar16]
  • Mitochondrial superheterogeneity: What it means [6Apr16]
  • Mitochondrial superheterogeneity and speciation [3May16]

[11] Dillon, R. T. (2020) Population genetic survey of Lithasia geniculata in the Duck River, Tennessee.  Ellipsaria 22(2): 19 - 21. [PDF]

[12] Dillon, R. T. (2020) Reproductive isolation between Lithasia populations of the geniculata and duttoniana forms in the Duck River, Tennessee.  Ellipsaria 22(3): 6 - 8.  [PDF]

[13] From upper left: GEN, GEN, DUT, DUT, GEN, GEN.

[14] Papers in which Russ Minton lumped L. geniculata and L. duttoniana:

  • Minton, R. L., A. P. Norwood & D. M. Hayes (2008) Quantifying phenotypic gradients in freshwater snails: a case study in Lithasia (Gastropoda: Pleuroceridae)  Hydrobiologia 605: 173-182.
  • Minton, R. L., K.C. Hart, R. Fiorillo, & C. Brown (2018) Correlates of snail shell variation along a unidirectional freshwater gradient in Lithasia geniculata (Haldeman 1840) (Caenogastropoda: Pleuroceridae) from the Duck River, Tennessee, USA.  Folia Malacologia 26(2): 95 – 102.

[15] But I’ll bet dollars to donuts that they hybridize.  I think hybridization is widespread in the North American family Pleuroceridae.  See the paper by Bianchi et al from footnote [3] above.

[16] Five pleurocerid species are visible grazing across this rock in the Duck River at the Watered Hollow Boat Launch (RM 26): Pleurocera canaliculata canaliculata, Pleurocera laqueata laqueata, Leptoxis praerosa praerosa, Lithasia geniculata geniculata, and Lithasia armigera jayana.  Notice that no juveniles are apparent whatsoever.  All massively-shelled adults!  I could write an entire essay on that phenomenon alone.

[17] A selection of papers showing typical levels of allozyme divergence between pleurocerid species:

  • Dillon, R.T. and G.M. Davis (1980) The Goniobasis of southern Virginia and northwestern North Carolina: Genetic and shell morphometric relationships. Malacologia 20: 83-98. [PDF]
  • Dillon, R. T., and S. A. Ahlstedt (1997) Verification of the specific status of the endangered Anthony's River Snail, Athearnia anthonyi, using allozyme electrophoresis. The Nautilus 110: 97 - 101. [PDF]
  • Dillon, R. T. and A. J. Reed (2002)  A survey of genetic variation at allozyme loci among Goniobasis populations inhabiting Atlantic drainages of the Carolinas.  Malacologia 44: 23-31. [PDF]

[18] A selection of papers showing typical levels of allozyme divergence among populations within species:

  • Dillon, R.T. (1984) Geographic distance, environmental difference, and divergence between isolated populations. Systematic Zoology 33:69-82.  [PDF]
  • Dillon, R.T. (1988) Evolution from transplants between genetically distinct populations of freshwater snails. Genetica 76: 111-119. [PDF]
  • Dillon, R.T., and C. Lydeard (1998) Divergence among Mobile Basin populations of the pleurocerid snail genus, Leptoxis, estimated by allozyme electrophoresis.  Malacologia. 39: 111-119. [PDF]
  • Dillon, R. T. and J. D. Robinson (2011)  The opposite of speciation: Population genetics of  Pleurocera (Gastropoda: Pleuroceridae) in central Georgia.  American Malacological Bulletin  29: 159-168.  [PDF]

[19] Minton, R. L. 2013. A new species of Lithasia (Gastropoda: Pleuroceridae) from the Buffalo River, Tennessee, USA. The Nautilus 127:119-124.

Friday, February 4, 2022

Character phase disequilibrium in the Gyraulus of Europe

Editor’s Note – This essay was subsequently published as: Dillon, R.T., Jr. (2023c)  Character phase disequilibrium in the Gyraulus of Europe.  Pp 215 – 226 in The Freshwater Gastropods of North America Volume 7, Collected in Turn One, and Other EssaysFWGNA Project, Charleston, SC.

I get a lot of requests for freshwater gastropod samples for sequencing studies.  And I confess, I can sometimes be a jerk about it.  In reply, I always ask, “What hypothesis do you plan to test?”  Note that answers of the form, “I want to work out the phylogeny of gastropod family X” or “I want to figure out how many species there are in the gastropod genus Y” do not qualify as hypotheses [1].

So back in October of 2020 I was pleased to receive an email from Jeff Nekola of Masaryk University in Brno, the hometown of Gregor Mendel, posing a very well-considered hypothesis to test with sequence data from specimens that I might provide him.  Jeff introduced me to his colleague Michal Horsak, and the two of them together pitched me a project to test whether their European Gyraulus laevis (Adler 1838) might be conspecific with our North American Gyraulus parvus (Say 1817).  Let’s back up for a bit of context.

G. laevis [4]
All I know about the planorbid genus Gyraulus in the Old World, I learned from Prof. Claus Meier-Brook, late of the University of Tubingen [3].  The symphony of malacology he composed in 1983, entitled “Taxonomic Studies on Gyraulus [4]” was a masterwork of rigor, scholarship, technical brilliance and timeless beauty, both scientific and otherwise [5].  Meier-Brook examined 492 Gyraulus sampled from 94 Eurasian populations, thoroughly cataloguing variation in scores of anatomical and morphological characters both common and obscure, carefully documenting ecophenotypic variance as well as variance due to method of preservation.  Ultimately, he recognized eight species in Europe (excluding Macedonia [6]) and seven in Asia (one shared) for a total of 14 species of Gyraulus in the Palearctic.

So G. laevis and G. parvus were both among the eight European species recognized as valid by Prof. Meier-Brook, the former ranging widely across Europe but “rather stenotopic and rare.”  The latter he considered native in Iceland, but introduced into Germany by the early 1970s, and rapidly spreading through Europe as he wrote his monograph.

The two species are quite difficult to distinguish in the field, and even as early as 1952 European workers were suggesting that laevis might be a junior synonym of parvus [7].  Meier-Brook disagreed.  And here is the couplet by which he suggested that we distinguish them, transcribed verbatim:

6A. Penultimate whorl distinctly elevated, distal portion of spermoviduct slender, not wider than widest portion of sperm duct; distal half of vas deferens much wider (2:1 on an average) than proximal half (introduced from N America)… G. parvus.

6B. Penultimate whorl not or not distinctly elevated, distal portion of spermoviduct wider than widest portion of sperm duct and vas deferens, distal half of vas deferens not conspicuously widened (1:1) … G. laevis.

The six samples of G. parvus upon which Meier-Brook based his diagnosis, however, were collected from Ann Arbor, two places in Canada, two places in Iceland, and Germany – none from Thomas Say’s type locality in the Delaware River near Philadelphia.  So the hypothesis advocated by my colleagues in Brno back in October of 2020 was an interesting one, and it did, indeed, seem likely to me that sequence data might cast some light upon it.

And my loyal readership may remember an expedition I undertook up the Delaware River in 2012, hunting the type locality of Thomas Say’s Lymnaea catascopium [8].  I had picked up incidental samples of G. parvus at two sites on that field trip, which I agreed to post to Brno at my next opportunity.

G. parvus [4]

Jeff and Michal also asked if I might be able to spare a couple samples of Gyraulus circumstriatus.  My antennae raised slightly at this request – it was hard to see how sequence data from G. circumstriatus might bear on the hypothesis before us.  And all I had on my shelves was a couple odd samples from Montana and NW Pennsylvania, nowhere near the Connecticut type locality.  But OK – in for a penny, in for a pound [9].

So in late January of 2021 I was pleased to receive an email from Michal reporting success in sequencing the samples that I had sent, and that “the preliminary phylogenetical analysis clearly says that these are the same species and there is also no difference from all European populations of G. parvus/laevis.”  And in mid-April a first draft manuscript arrived, courtesy of Ms. Erika Lorencova, the lead author on the project.

I found some things to like about the research as the manuscript unfolded before my eyes last spring.  Lorencova, Nekola, Horsak, and five additional coauthors [10] had sequenced four genes (COI, CYTB, ITS1, ITS2) from 65 individual snails representing seven nominal species of Gyraulus, plus a Planorbis outgroup – just one single individual per population, in almost all cases, alas.  They did not sequence all four genes for all 65 individuals, alas again.  Their data set included 34 individuals identified as G. parvus (27 Czech, 2 Slovak, 1 Croat, 1 Aust, 1 Serb, 2 USA) and 14 individuals identified as G. laevis (12 Czech, 2 Croat), none of the latter collected from anywhere near Alder’s type locality in England, which pissed me off royally.  Their data set did, however, include one individual collected from Scotland, one from Northern Ireland, and two from Wales, all identified as “parvus/laevis,” none of which helped one little bit.

Erika and our mutual colleagues opted to analyze their (mitochondrial) COI + CytB dataset separately from their (nuclear) ITS1 + ITS2 dataset.  They generated gene trees using four different methods for each data set: neighbor-joining, maximum parsimony, maximum likelihood, and Baysian inference, for a total of eight separate analyses.  All of these “yielded very similar tree topologies.”  If not, I suppose our friends in Brno could have picked the one they liked best.

In any case, the Baysian tree based on CO1 + CytB is shown on the left in their Figure 2 modified below, and the Baysian tree based on ITS1 + ITS2 is shown on the right.  Both trees vividly demonstrate character phase disequilibrium of a high and aggravated nature.  If at any point during the next seven paragraphs you fail to understand anything I am saying to you, please go back to my essay of [4Jan22] and read forward.
Fig 2 of Lorencova et al [16] modified

Let us first focus on the COI+CytB mtDNA tree at left.  Erika, Jeff, Michal and colleagues divided the 42 individuals depicted on the giant branch at the bottom of their tree into three “races,” which they distinguished using Roman numerals I, II, and III.  The mean uncorrected p-difference between Race I and Race II was 4.4%, between Race I and Race III it was 5.1%, and between Race II and Race III it was 5.5% [11].

Right-click on the figure above, open it in a new window, and count with me.  In Race I we see 6 parvus (red) and 12 laevis (blue), setting aside the 1 parvus/laevis (no count).  In Race II we see the two circumstriatus [12].  And in Race III we see 15 parvus, 2 laevis, and 4 parvus/laevis (no count).

In Table 1 below I have combined all 35 of the (classified) Gyraulus and categorized them simultaneously by nominal species and mtDNA race. The contingency chi-square is a very significant 10.98 (1 df).  This is character phase disequilibrium.  These 35 snails are not drawn from a single randomly-breeding population.

Tab 1. Gyraulus classified by species and mtDNA

Shifting our attention to the nDNA tree at right, we find the percent sequence divergence much less, but the character phase disequilibrium even more significant.  Lorencova and colleagues did not divide the gigantic branch at the bottom of their nDNA tree into “races” as they did for their mtDNA tree, but they easily could have done so.  There seem to be just two ITS1+ITS2 races, rather than the three we saw for mtDNA, and they differ by only a couple nucleotides.  But the match between the top half of the big branch of the nDNA tree is very close to the top half (“Race I”) of the big branch of the mtDNA tree.  And ditto for the two bottom halves.  Note that the same two individuals labelled “laevis” in the lower (Race III) clade on the mtDNA tree at left are exactly the same two individuals labelled “laevis” in lower clade by their nDNA at right, for example.

And indeed, laevis is again very much over-represented in the upper clade in the nDNA tree, which we might as well go ahead and call Race I, and parvus very much over-represented in the lower clade, which we might as well call Race III.  For the nDNA, Table 2 below shows that the contingency chi-square is 12.89 (1 df), even more significant than the mtDNA results.  What gives?

The 42 individual Gyraulus hanging on the big, low branches of the two gene trees shown above were not drawn from a single randomly-breeding population.  In large and complexly-structured environments, such as Erika’s six-country sample area most certainly is, the first thought of an evolutionary biologist would be that any such non-random mating might arise from barriers to dispersal or isolation by distance.  So let’s re-run our analysis focusing just on the 29 individual Gyraulus collected from the Czech Republic.  The mtDNA breakdown is Race I parvus = 5, Race I laevis = 11, Race III parvus = 11, Race III laevis = 2, chi-square (1 df) = 8.26, still quite significant.

Tab 2. Gyraulus classified by species and nDNA

I suppose it is possible that there might be some sort of geographic structure in the 29 Czech samples below the level of the country in which they were sampled, but I do not have the patience to plot 29 sets of lat/long coordinates and look for it.  I will simply note that there is another very plausible explanation for the character phase disequilibrium apparent in the branches of the gene trees developed by Erika, Jeff, Michal and our mutual colleagues, beyond some sort of fine geographic structure that I cannot see.  Perhaps the two sets of populations they have identified as G. parvus and G. laevis are in fact good, biological species, genetically and morphologically similar but reproductively isolated, with a smattering of misidentifications [13] or a hybridization event here and there.  In any case, the results of Lorencova et al. (2021) do not support their hypothesis that G. parvus and G. laevis are conspecific.

All through the second half of the month of April I carried on a detailed and earnest email correspondence with my colleagues in Brno, desperately trying to get them to see the reasoning I have outlined in the seven paragraphs above.  I explained character phase disequilibrium every way I know how to explain it, backing all the way up to Mendel and coming forward, drawing diagrams with circles and arrows and a paragraph on the back of each one explaining what each one was [14].  I calculated probabilities to the fourth decimal place and highlighted them in bold.  And I simply could not make Jeff, Erika, or Michal understand character phase disequilibrium, or its origins in non-random mating, or the likelihood that the disequilibrium evident in the branches of their trees might reflect reproductive isolation, or indeed (in retrospect) the connection between reproductive isolation and speciation.

Alas, we seemed to be speaking different languages.  Rather than the term, “species,” my colleagues preferred the term,  “species-level clade.”  And they concluded that G. parvus and G. laevis were “part of the same species-level clade” because “although reasonably well-supported races exist in the mtDNA tree their base pair variability is three times smaller than that seen between the other analyzed Gyraulus species” [15].

Nor apparently could the editor of the international journal to which my colleagues submitted their paper see the character phase disequilibrium in their Figure 2 as modified above, nor understand its significance, nor apparently could the reviewers he chose.  Apparently, there is widespread blindness in evolutionary biology today to simple principles of transmission genetics that I have considered fundamental for my entire professional career.  The paper by Lorencova and colleagues was published in July [16].  Going beyond their proposed synonymization of G. laevis under G. parvus, our colleagues in Brno went so far as to suggest that “North American G. circumstriatus might simply represent another race within G. parvus.”  Good grief.

Well, science is a self-correcting process.  Someday some bright young student will realize that the answer to the parvus/laevis question does not lie in sampling a single individual from 30 populations, but in sampling 30 individuals from a single population.  He will find a lake or a pond inhabited by Gyraulus bearing both the Race 1 and Race 3 haplotypes [17].  He will collect and sort 30 adults by the elevation of their penultimate shell whorl, sequence those genes, and look for disequilibrium between mtDNA race, nDNA race, and shell morphology.  And here is his hypothesis: big excesses of Race 1/flat whorl and Race 3/elevated whorl.  Will our bright young student find any Race 1/elevated or Race 3/ flat recombinants?  Will he find any ITS heterozygotes?  Good questions.

I will conclude with a caveat.  I am not aware of any research directly bearing on mode of reproduction in Gyraulus, but my biological intuition suggests to me that populations of trashy, weedy planorbids such as G. parvus most certainly is might demonstrate significant frequencies of self-fertilization.  Asexual reproduction voids the biological species concept and necessitates a retreat to the solid rock of morphology, not a blundering-forward into the slough of DNA [18]

So if our bright young student of the future confirms preferential selfing in Gyraulus, and googles up this essay and reads it, I would ask him to go back to my essay of [4Jan22], read to note [3] and stop.  The first nine paragraphs of my January essay will have turned out to be important for Gyraulus, but the remainder not.  And then I would suggest that he come forward to the present blog post, re-read from the top of my essay to Claus Meier-Brook’s couplet distinguishing G. parvus and G. laevis morphologically, and then stop again.  Because none of the rest of this month’s post will have turned out to be relevant, either.  To the extent that Gyraulus populations self-fertilize, Professor Meier-Brook’s brilliant 1983 monograph stands as the final word thus far.


Notes

[1] If, however, the opening lines of the present essay happen to fall upon the eyes of a bright young student with access to a molecular lab and an interest in real science [2], I stand ready to help in any way I can.  I even have a list of genuine hypotheses about the evolution of freshwater gastropods ripe for testing with sequence data, for students in the market for thesis topics.  A long list.

[2] Science is the construction of testable hypotheses about the natural world.

[3] Claus Meier-Brook (1934 - 2018) has occupied a niche in my malacological pantheon since the dawn of my professional career.  I never met him, although we enjoyed a cordial correspondence in the 1980s.  He was best known for his work on pisiidid clams, but also made important contributions to our understanding of the medically-important planorbids.  He was unable to resist the Willi Hennig fad, alas, but the cladist gobbledygook is easy to subtract from his otherwise inspiring oeuvre [5].  For a biography and bibliography, see:

  • Jungbluth, J. H. (2006) Claus Meier-Brook 70-Jahre (28  April  1934).   Mitteilungen  der Deutschen Malakozoologische  Gesellschaft 75:  39-47.

[4] Meier-Brook, C. (1983)  Taxonomic studies on Gyraulus (Gastropoda: Planorbidae).  Malacologia 24: 1 – 113.

[5] And I feel like Salieri.  Rifling the pages of his papers, hearing the beauty of the science in my mind’s ear – a rusty squeezebox, high above it a single oboe – my heart breaking.  But jeeze, crap!  Hit the fast-forward button through Movement VI, Cladiste.

[6] Meier-Brook recognized six Gyraulus species endemic to Macedonian lakes.

[7] Jaeckel, S. (1952) Zur Oekologie der Mollusken-fauna in der westlichen Ostsee. Sctiriften des Naturwissenscfiaftlictien Vereins fur Sctileswig-Holstein. 26: 18-50.

[8] It is traditional to assume that Thomas Say’s type localities for both G. parvus and L. catascopium were in the Delaware River at his home town of Philadelphia.  But 200 years of commercial development at the Philadelphia waterfront have rendered that environment unrecognizable today.  For an account of my explorations upstream, see:

  • The Type Locality of Lymnaea catascopium [14July15]

[9] Or more accurately, “In for 200 mg of snail flesh, might as well go all in for a half gram.”

[10] Michal offered me a coauthorship, which was very considerate of him, and I did appreciate the honor, but ultimately declined.

[11] MtDNA sequence divergences in the 4 – 5% range are quite consistent with the values typically reported among valid, biological species of freshwater pulmonate snails.  But that is not the direction I want to go in the present essay.

[12] The two G. circumstriatus sequences, sampled as they were from Montana and British Columbia, geographically remote from all 40 of the samples of parvus and laevis available for comparison, have no bearing on the specific status of circumstriatus whatsoever.

[13] Meier-Brook considered G. laevis and G. parvus sibling species, which means that they cannot be distinguished morphologically, and then spent many pages developing evidence to the contrary, ironically.

[14] By now I imagine that the origin of last month’s blog post will have become obvious to my perceptive readership.  My essay of 4Jan22 was an adaptation of the extensive email correspondence I carried on with Jeff Nekola and Michal Horsak in April of 2021.  And the reason for all those examples involving Mendel’s peas was that I was trying to communicate with geneticists in Brno.  And vainly searching for a language that we might have in common.  See:

  • What is character phase disequilibrium? [4Jan22]

[15] Darn it, I know I said in footnote [11] that this is not a direction I want to go with the present essay.  But it’s eating at me.  Although the “base pair variability” observed among the laevis, parvus, and circumstriatus clusters may indeed be “three times smaller than the values seen between the other analyzed Gyraulus species,” the values of 4 – 5% mtDNA sequence divergence among those groups reported by Erika, Jeff, Michal and colleagues are NOT small when compared to interspecific values typical for biological species of freshwater pulmonates worldwide.  See, for example:

  • The Lymnaeidae 2012: Stagnalis yardstick [4June12]

[16] Lorencova, E., L. Beran, M. Novakova, V. Horsakova, B. Rowson, J. Hlavac, J. Nekola, and M. Horsak (2021).  Invasion at the population level: a story of the freshwater snails Gyraulus parvus and G. laevis.  Hydrobiologia 848: 4661 – 4671.

[17] A clean answer to the question that has sent nine scientists, including yours truly, scampering around the world to not answer may be waiting 60 km south of Brno.  For according to the supplementary materials available with their paper, Erika, Michal, Jeff & Company did collect snails they identified as both parvus and laevis together in a fishpond on the northern edge of the Czech town of Hlohovec.

[18] I vividly illustrated the folly of attempting to classify asexually-reproducing populations by DNA sequence data in two recent series of blog posts: one on the (parthenogenic) prosobranch Campeloma and a second on the (self-fertilizing) pulmonate Galba.  See:

  • Fun with Campeloma! [7May21]
  • What Lymnaea (Galba) schirazensis is not, might be, and most certainly is [3Aug21]

Tuesday, January 4, 2022

What is character phase disequilibrium?

Editor’s Notes - About halfway through this essay I refer to original research conducted with two forms of Lithasia on the Duck River, GEN and DUT.  That work was published as a note in Ellipsaria 22(3) [pdf] if you are looking for something citable [1]. The present essay was subsequently published as: Dillon, R.T., Jr. (2023b)  What is character phase disequilibrium?  Pp 153 – 162 in The Freshwater Gastropods of North America Volume 6, Yankees at The Gap, and Other EssaysFWGNA Project, Charleston, SC.

It has come to our attention that some non-negligible fraction of our professional colleagues do not understand transmission genetics.  I suppose I might have seen it coming.  Over the 33 years I spent as a genetics professor at a mid-sized college of regional reputation, textbook chapters devoted to Mendel and Morgan became skinnier and skinnier, squashed by bulging chapters of molecular ephemera.  Some of my younger colleagues seemed to consider that transmission and population genetics were epiphenomena, to be mentioned, perhaps, on the way to the subject matter that might actually be useful or interesting to the students.

So before launching into this month’s lecture, I am springing a pop quiz.  Everybody please return with me to my November essay on Leptoxis.  You can either scroll down below the lengthy January essay that follows and the (somewhat shorter) December essay below that or open this link in a fresh window [2Nov21].  Now read the four paragraphs about “the third important lesson” halfway through that essay, including footnotes #13 and #14, paying special attention to the material about “snail 5S.”  When you get to “0.05^2 = 0.0025” in footnote #14, stop.  If you understand the importance of that calculation, feel free to skip this month’s essay, and I’ll see you next month.  But if all that stuff about snail 5S and its parentage is foggy to you, read on.

Gregor Mendel proposed his “second law” on the strength of an experiment he conducted in his pea garden using two genes: seed color (yellow/green) and seed shape (smooth/wrinkled).  He interpreted the 9:3:3:1 phenotypic ratio he observed in the F2 from his dihybrid cross as the result of independent assortment of those two genes.

From Lobo & Shaw [2]
Very shortly after the rediscovery of Mendel’s work, however, results began to crop up that did not jive with Mendel's second law.  In 1905 the team of Bateson, Saunders and Punnett obtained an F2 ratio from a dihybrid cross involving flower color (purple/red) and pollen shape (round/long) that did not match 9:3:3:1 expectation.  They got too many of the purple/long and red/round “parental” phenotypes, and not enough of the purple/round and red/long “recombinants.”

And in 1910-11, the American Thomas Hunt Morgan confirmed the “chromosomal theory of inheritance” in fruit flies, coining the term “linkage” to describe the situation where a pair of genes might not assort independently because they were located on the same chromosome [2].  Although the term was not invented at the time, the situation in William Bateson’s field of peas would today be called linkage disequilibrium.

Now let me ask you to do a thought experiment.  Plant your own 50:50 mixed field of peas, using Mendel’s genes, not Bateson’s – half smooth/yellows and half wrinkled/greens.  Plant them in alternating rows, smooth/yellow mixed evenly with wrinkled/green.  Go away for two generations and come back to check the F2.  Remember that seed color and seed shape are not linked.  Would you expect to count the same 9:3:3:1 that Mendel observed? 

Surprise!  No, you do not.  You would find way too many of the “parental” phenotypes – the smooth/yellows and the wrinkled/greens, just like William Bateson found too many purple/long and red/round in 1905.

I have asked you what my students used to call a “trick question.”  They called it that because that’s what it is.  Peas are normally self-pollinating.  Mendel physically dusted all the round/yellow stigmas of his parental generation with wrinkled/green anthers, allowed the parents to set seeds, planted them, reared the F1, and then allowed the F1 to (naturally) self-pollinate to get his F2 results.  But in the field of peas we just imagined in the paragraph above, I told you simply to “go away for two generations.”  Absent intervention by you or an Augustinian monk, in two generations your pea field will remain exactly as you planted it, half smooth/yellows and half wrinkled/greens.  Way, way too many parentals.

Independent assortment assumes random mating.  If (for example) there is any tendency for round/yellows to pollinate other round/yellows or wrinkled/greens to pollinate other wrinkled/greens, the seed shape gene and the seed color gene will remain associated in the pea field, as though there were linked on the same chromosome, even though they are not.  Some people also call this phenomenon “linkage disequilibrium,” even though the genes involved are not physically located on the same chromosome.  I prefer a newer term, “gametic phase disequilibrium.”  And I like to describe the situation in our monkless field of peas as stable gametic phase disequilibrium [3].

So, let’s take a concrete example.  Last month we featured a dataset documenting variance at three allozyme-encoding loci (Odh, Mpi, and Hexdh) in seven subpopulations of Lithasia geniculata sampled down the length of the Duck River in Middle Tennessee [4].  Although I did not mention it, there are two different-looking shell forms of Lithasia at the three most downstream sites: one bearing typical-looking, oblong, bumpy shells (GEN), and a form with a more acute apex and angled (sometimes even tuberculate) shell (DUT).  Paul Johnson, Steve Ahlstedt and their colleagues sampled both the oblong- bumpy GEN form and the angulate-tuberculate DUT form at these three sites in 2002, bagging them separately [1].  The gene frequencies I reported last month were for the GEN form only.

In Table 1 below I have combined the GEN and DUT samples collected at Wright Bend (site E) for a total of 2(78) = 156 haploid genomes [5].  Each haploid genome is classified jointly by the allele resolved at the Odh and Hexdh loci, with observed counts above the slash, and expected below.

Table 1 shows evidence of disequilibrium between the Odh and the Hexdh locus, with excesses of Odh112/Hexdh93 and Odh109/Hexdh99 association.  The 3x2 contingency chi-square (setting aside rare allele Odh114) was 7.69, significant at the 0.05 level.  This sample does not seem to have been collected from a randomly-breeding population.

And indeed, a similar analysis combining the 32 GEN individuals collected at Site D with 34 DUT individuals would yield similar results, and ditto again were we to combine the 33 GEN and 35 DUT individuals collected at Site F.  The evidence suggests that this case of gametic phase disequilibrium is stable.

Now let’s generalize the situation one step further.  The gametic phase disequilibrium documented in Table 1 is correlated with shell phenotype.  It disappears when either GEN or DUT is analyzed separately, at all three sample sites.  Lithasia bearing shells of the oblong-bumpy GEN phenotype demonstrate significantly higher frequencies of Odh112 and Hexdh93 than Lithasia bearing acute, angulate DUT shells at all three sites where they were collected together. 

Tab 1. Site E, GEN and DUT combined
I have tabulated allele frequencies by shell morphology (observed/expected) for Site E in Table 2 below.  The contingency chi-square at the Hexdh locus is a whopping 41.2 (1 df) and that at the Odh locus (again setting aside rare allele Odh114) is 27.0 (2 df), both highly significant.  And again, the complete data set, for all three sites and all three loci, is available in the report I published in Ellipsaria 22(3) last year [1].

Shell morphology is a function of both genetics and environment, of course.  Heaven knows that enough pixels have sacrificed their flickering lives to both those fractions of the variance on this blog [6].  But Table 2 shows that the component of shell morphological variation that Johnson, Ahlstedt and their colleagues used to distinguish GEN from DUT in 2002 is correlated with variance in two demonstrably genetic markers, Hexdh and Odh.  And there is no apparent correlation between shell morphology and environment in this situation, whatever environmental variance there might have been within sites rendered negligible by the variance between. 

Let us broaden the concept of gametic phase disequilibrium to include measures of the phenotype, shall we?  Here I suggest a new term, “character phase disequilibrium” to describe situations such as documented in Table 2, where variation in the phenotype correlates with variation in the genotype.  I define CPD as “any violation of independent assortment between one or more morphological characters and one or more characters of demonstrably genetic origin” [7].

The potential underlying causes of character phase disequilibrium are identical to the causes of the better-known gametic phase disequilibrium.  In the case of the Lithasia of the Duck River, the cause of the disequilibrium between genotype and phenotype is almost certainly a violation of the assumption of random mating.  But of what origin?

In natural populations inhabiting large and complex environments, the first thought of an evolutionary biologist would be that any observed non-random mating would arise from barriers to dispersal or simple isolation by distance, as we obsessed over on this blog from September to December [8].  And in fact, we have very thoroughly documented both phenomena in the Lithasia populations of the Duck River [1, 4].

Tab 2. Site E, GEN and DUT separate
But here we see the same association between shell morphology and allozyme frequency in a sample (D) collected at Duck River mile 145.6, and in a second sample (E) sampled at Duck River mile 42.6, and in a third sample (F) collected from Duck River mile 25.7.  The CPD phenomenon cannot be attributed to physical barriers to dispersal or to isolation by distance in this case.

Rather, the data suggest that the GEN subpopulation bearing bumpy, oblong, typical shells and the DUT subpopulation bearing acute, angulate shells are reproductively isolated biological species, at all three of the sample sites tested down a 120-mile length of the Duck River.  The situation is apparently stable.

OK, coming off the backstretch now, heading for home.  Let me ask you to do one more thought experiment with Mendel’s peas.  For this experiment I will ask you to assume that peas are outcrossers, not selfers.  And this time, plant a field almost entirely of green/wrinkled peas, with one single yellow/smooth pea planted in the center.  Remember that seed color and seed shape are not physically linked, and this time your singleton yellow/smooth pea plant can freely cross-pollinate with its neighbors, as in a normal field of flowers.  Would the two loci appear to assort independently?

The answer is no.  I’ve asked you another trick question.  I didn’t mention anything about the passage of generations.

Initially, standing on the edge of your newly-planted pea garden with your hands on your hips, seed color and seed shape appear to be tightly linked, because the only plant with yellow seeds has smooth seeds.  And if you let your plants cross-pollinate, set seed, die, and bring forth a fresh generation, seed color and seed shape will still appear tightly linked, because every pollen grain made by your yellow plant was also marked with the smooth allele.  All the yellow F1* will still have smooth seeds, remembering that both yellow and smooth are dominant.  It might take quite a few generations [9] for the two loci, seed color and seed shape, to diffuse independently into the pea population before linkage disappears.  But it will, eventually, disappear.  This is unstable gametic phase disequilibrium.

And I am sure that my readership will have no difficulty extending the situation with the shell morphology in the Lithasia populations of the Duck into the pea garden of thought-experiment #2.  If our mixed field of randomly outcrossing peas were to demonstrate variance in some morphological trait of unknown heritability, as well as variance in the two for which the genetic basis is well-documented, we would not be surprised to observe unstable character phase disequilibrium.

So finally.  Character phase disequilibrium describes the situation with the singleton 5S snail that Nathan Whelan collected in his sample from the “Sixmile” Leptoxis subpopulation [10].  That snail simultaneously bore both the genetic markers and the shell morphology of the “Bulldog” population upstream.  But is that disequilibrium stable or unstable?   All those obscure calculations in footnotes #13 and #14 of my November essay were my efforts to answer that question.

Detail from Whelan et al [10] Fig 2 
My first thought was that snail 5S might be the offspring of a pure Sixmile parent and a pure Bulldog parent, analogous to the F1 pea generation marked with an asterisk(*) three paragraphs above.  Nathan seemed to imply that the 5S shell morphology was indistinguishable from the Bulldog parent, just as the phenotype of the F1 peas in thought experiment #2 were indistinguishable from their yellow, smooth parents, because of dominance.  The disequilibrium looks unstable at first blush, Bulldog and Sixmile freely interbreeding.

But if my first thought were true, the genotype of snail 5S would be 50/50.  The apparent excess of Bulldog genome made me consider the possibility that snail 5S might be an F2 or higher, with a pure Bulldog parent backcrossed to a second parent containing some Bulldog genome, which would be highly unlikely unless there were some reproductive isolation between Bulldog and Sixmile.  In other words, the character phase disequilibrium at Sixmile might be stable.  And the Bulldog and Sixmile populations have speciated?  Really?

In retrospect, all that wheel-spinning in footnotes #13 and #14 of my November post was entirely unnecessary.  One need only look downstream to Nathan’s Centreville sample, which was a melting-pot of Bulldog, Sixmile, Centreville, and other populations as well.  The excess Bulldog genome in snail 5S is just slop, there is no evidence of reproductive isolation, the character-phase disequilibrium at Sixmile is unstable.

Thus endeth the lecture.  I apologize for going full-professor on you all this month, especially since in 33 years of effort I was never able to advance beyond a second-rank professorship at a third-rank college in a fourth-rank state.  But a firm grasp of the principles I have outlined above is essential for a successful career in evolutionary biology.  Or at least, it used to be.  Tune in next time.


Notes

[1] Dillon, R. T. (2020) Reproductive isolation between Lithasia populations of the geniculata and duttoniana forms in the Duck River, Tennessee.  Ellipsaria 22(3): 6 - 8.  [pdf]

[2] Here’s a link [html] to a very nice educational resource published by Nature, reviewing the early work on genetic linkage of Bateson et al (1905) and Morgan (1910, 1911):
  • Lobo, I. & Shaw, K. (2008) Discovery and types of genetic linkage. Nature Education 1(1):139.

[3] This is a place-keeper footnote, which I will call up next month.

[4] Dillon, R. T., Jr. (2020) Population genetic survey of Lithasia geniculata in the Duck River, Tennessee.  Ellipsaria 22(2): 19 - 21 [pdf].  For more, see:

  • Intrapopulation gene flow: Lithasia geniculata in the Duck River [7Dec21]

[5] This is somewhat less than you might expect summing the locus totals published in [1], because for a few individuals I was able to obtain results at one locus and not the other.  Data from both loci are required for the joint analysis shown in Table 1.

[6] If you hit the “Phenotypic Plasticity” label above right you will find (as of January 2022) no fewer than 28 essays touching on the heritability of shell morphology in freshwater gastropods.   If I had to pick two, my favorite from the environmental side would probably be the first listed below, and my favorite from the genetic side would most certainly be the second, with the references cited in both:

  • Pleurocera acuta is Pleurocera canaliculata [3June13]
  • The heritability of shell morphology h^2 = 0.819! [15Apr15]

[7] We have also touched on the concept of character phase disequilibrium in several previous essays on this blog.  An understanding of CPD was critical to my series on the cryptic Pleurocera of Maryville:

  • The cryptic Pleurocera of Maryville [13Sept16]
  • The fat simplex of Maryville matches type [14Oct16]
  • One Goodrich missed: The skinny simplex of Maryville is Pleurocera gabbiana [14Nov16]

I didn’t call the phenomenon anything at the time because I thought that the concept of CPD was obvious and didn’t need a name any more than it needed an explanation.  Looking back, my Maryville research demonstrated the power that an understanding of character phase disequilibrium can bring to evolutionary science.  But maybe I should have posted the present essay back in 2016.

[8] Here is my series on gene flow within populations of freshwater gastropods:

  • Intrapopulation gene flow: King Arthur’s lesson [7Sept21]
  • Intrapopulation gene flow: The polymorphic Pleurocera of Naked Creek [11Oct21]
  • Intrapopulation gene flow, the Leptoxis of the Cahaba, and the striking of matches [2Nov21]
  • Intrapopulation gene flow: Lithasia geniculata in the Duck River [7Dec21]

[9] The number of generations required will be a function of both the rate of gene flow and the effective population size.  In fact, the level of gametic phase disequilibrium observed is one of two methods by which the effective size of a population can be estimated.  For more, see:

  • The best estimate of the effective size of a gastropod population, of any sort, anywhere, ever [14Jan19]

[10] Whelan, N. V, M. P. Galaska, B. N. Sipley, J. M. Weber, P. D. Johnson, K. M. Halanych and B. S. Helms (2019)  Riverscape genetic variation, migration patterns, and morphological variation of the threatened Round Rocksnail, Leptoxis ampla. Molecular Ecology 28:1593-1610.  For a review, see:

  • Intrapopulation gene flow, the Leptoxis of the Cahaba, and the striking of matches [2Nov21]