Dr. Rob Dillon, Coordinator


Tuesday, December 7, 2021

Intrapopulation gene flow: Lithasia geniculata in the Duck River

Editor’s Notes - This essay is the fourth and final installment of a series on isolation by distance and barriers to dispersal within populations of pleurocerid snails.  The original research upon which it was based was published in Ellipsaria v22(2) [pdf], if you’re looking for something citable. This essay was subsequently published as: Dillon, R.T., Jr. (2023b)  Intrapopulation gene flow: Lithasia geniculta in the Duck River.  Pp 147 – 152 in The Freshwater Gastropods of North America Volume 6, Yankees at The Gap, and Other EssaysFWGNA Project, Charleston, SC.

The modern era of American malacology dawned in 1934, on page 8 of the University of Michigan Museum of Zoology Miscellaneous Publication #286 [1].  For it was there that Calvin Goodrich first advanced his model of shell variation in the Lithasia geniculata population of the Duck River in Middle Tennessee.  Goodrich argued that that pleurocerid populations previously identified as Anculosa pinguis, Lithasia fuliginosa, and Lithasia geniculata were all variants in a 270 mile cline, lowering the first two nomina to subspecific status under the third.

This was not taxonomic bit-fiddling.  It was a throwing off of typological thinking, and an anticipation of the biological species concept eight years before Mayr hove it like Simba before the African host [2].  We first featured Goodrich’s model for the Duck River Lithasia on this blog way back in February of 2007, and have returned to it twice since then, in July of 2014 and September of 2019 [3].

So when I opened an email from Paul Johnson in the summer of 2002, offering to ship me an extensive series of Lithasia samples collected down the length of the Duck, frozen and ready for allozyme electrophoresis, I jumped at the chance.  Paul was working with our good friend Steve Ahlstedt and a host of collaborators on a survey of the unionid mussel fauna of the Duck [4] and had sampled Lithasia as an ancillary.  This seemed like a marvelous opportunity to generalize some of the observations I had made on intrapopulation genetic variation in Pleurocera proxima during my dissertation years [5] and add a dramatic shell morphological component as well.

The samples arrived in Charleston on dry ice shortly thereafter.  Paul, Steve, and their colleagues had collected 50+ individuals from six sites down the length of the Duck, as shown in the figure above, plus a seventh site on the Buffalo River, a major downstream tributary.  The two upstream subpopulations (pinA and pinB) Paul identified as L. geniculata pinguis, the next one (fulC) was L. geniculata fuliginosa, and the three most downstream sites (genD, genE, genF) he identified as typical L. geniculata geniculata.  Paul’s sample from the Buffalo River he identified as L. geniculata fuliginosa (fulG).

And I went straight to work, initially screening for allozyme variance at 17 loci, finding three polymorphic: Octopine dehydrogenase (Odh, 2 alleles), Mannose-phosphate isomerase (Mpi, 3 alleles) and Hexanol dehydrogenase (Hexdh, 2 alleles).  For those three loci, I cranked up the sample size to around 30 – 40 individuals for each of the 7 subpopulations.

The graph below shows the frequency of the most common allele [9] at the three polymorphic loci as a function of Duck River mile.  The similarity between this graph and the graph of Odh frequency in the P. proxima population of Naked Creek [12Oct21] is striking, both data sets showing a dramatic swing in allele frequencies between their most upstream sample sites. 

Although separated by just 3.5 river miles, subpopulations pinA and pinB demonstrated a fixed difference at the Mpi locus and a nearly fixed difference at the Odh locus.  All N=41 pinA snails were homozygous for Mpi97 and Odh112, while all N=28 pinB snails were homozygous for Mpi94, with 25 of the 28 homozygous for Odh109.  This result is also quite reminiscent of the results reported by Whelan and colleagues for the Leptoxis of the Cahaba, reviewed here last month [10].

In Pleurocera proxima, this phenomenon was attributable to a barrier to gene flow at a corrugated metal pipe.  In Lithasia geniculata, the exactly analogous phenomenon is attributable to the falls of the Duck River – a bit more dramatic, but no Niagara.  The main Duck River and the Little Duck River drop over several named waterfalls in Old Fort State Park west of Manchester.  Judging from Paul’s collection data, the barrier between pinA and pinB may be Step Falls, a pretty little 30 ft drop, figured below.  That’s one small step for Man, one giant leap for Snail-kind.

Gene frequency variance was also significant down the remainder of the Duck River at the sample sizes tested, although less dramatic.  Subpopulations pinB, fulC and genD differed from each other at the Odh locus, while genD, genE and genF differed from each other at the Mpi locus.  Buffalo River subpopulation fulG differed significantly from genF at both Odh and Mpi [11].  Differences of these magnitudes seem attributable to isolation by distance, rather than any discrete barrier to dispersal.

Step Falls of the Little Duck R.

But it was shell morphological variation that attracted us to the Lithasia geniculata population of the Duck River, and it is with shell morphological variation that we will conclude.  No keen-eyed 19th-century taxonomist has ever assigned different Latin nomina to the Lithasia above and below the falls of the Duck River.  The shells born by subpopulations pinA and pinB are indistinguishable, despite the fact that gene flow from the latter to the former is apparently negligible.

Taxonomists have, however, fallen over themselves racing to describe new species of Lithasia down the remainder of the Duck River, even though gene flow among the subpopulations inhabiting its lower 270 miles is apparently greater.  Such observations are consistent with the hypothesis that much of the shell morphological variation observed in the Lithasia geniculata population of the Duck River is ecophenotypic in origin.

It was the work of Calvin Goodrich that inspired me back in 2007 to propose the phenomenon ultimately re-christened CPP, cryptic phenotypic plasticity [12]. I never insisted that CPP must have its origins in the non-genetic components of shell morphological variance but results such those as I published in 2011, 2013 and 2014 have certainly pointed in that direction.  The Lithasia geniculata population of the Duck River does, too.


Notes

[1] Goodrich, C. (1934) Studies of the gastropod family Pleuroceridae - I. Occas. Pprs. Mus. Zool. U. Mich. 286: 1 - 17.

[2] Mayr, E. (1942) Systematics and the Origin of Species.  Columbia University Press, NY.

[3] I have explicitly featured Goodrich’s model for the Duck River Lithasia geniculata in three previous essays. The influence of that seminal work has been papable in many more:

  • Goodrichian taxon shift [20Feb07]
  • Elimia livescens and Lithasia obovata are Pleurocera semicarinata [11July14]
  • CPP Diary: The spurious Lithasia of Caney Fork [4Sept19]

See my 2007 essay for the L. geniculata detail of Goodrich’s Plate I, and my 2014 essay for a scan of the entire plate.

[4] Ahlstedt, S. A., J. R. Powell, R. S. Butler, M. T. Fagg, D. W. Hubbs, S. F. Novak, S. R. Palmer and P. D. Johnson (2017) Historical and current examination of freshwater mussels (Bivalvia: Margaritiferidae: Unionidae) in the Duck River basin Tennessee, USA. Malacological Review 45:1-163.

[5] My research project on gene flow in the Naked Creek population of Pleurocera proxima was ultimately published in three different ways.  The 1979 results, in their entirety, were published as Chapter 2 of my 1982 dissertation [6].  The barrier-to-dispersal portion of that 1979 study was combined with data from 1980 and 1985 and published in 1988 [7].  The isolation-by-distance portion of my 1979 study was published just last year in Ellipsaria [8].  For an overview of the entire research program, see:

  • Intrapopulation gene flow: The polymorphic Pleurocera of Naked Creek [12Oct21]

[6] Dillon, R.T. Jr (1982)  The correlates of divergence in isolated populations of the freshwater snail, Goniobasis proxima.  Ph.D. Dissertation, University of Pennsylvania. 182 pp.  Dissertation Abstracts 43: 615B

[7] Dillon, R.T., Jr. (1988) The influence of minor human disturbance on biochemical variation in a population of freshwater snails. Biological Conservation 43: 137-144.  [pdf]

[8] Dillon, R. T. (2020) Fine scale genetic variation in a population of freshwater snails. Ellipsaria 22(1): 24 - 25.  [pdf]

[9] Weighted average over all seven sites.

[10] Whelan, N. V, M. P. Galaska, B. N. Sipley, J. M. Weber, P. D. Johnson, K. M. Halanych and B. S. Helms (2019)  Riverscape genetic variation, migration patterns, and morphological variation of the threatened Round Rocksnail, Leptoxis ampla. Molecular Ecology 28:1593-1610.  For a review, see:

  • Intrapopulation gene flow, the Leptoxis of the Cahaba, and the striking of matches [2Nov21]

[11] The Buffalo River Lithasia population has been described as a unique species.  Allozyme data do not support that hypothesis, however.  See:

  • Minton, R. L. (2013) A new species of Lithasia (Gastropoda: Pleuroceridae) from the Buffalo River, Tennessee, USA. The Nautilus 127:119-124.

[12] “Cryptic phenotypic plasticity” is defined as “interpopulation morphological variance so extreme as to prompt an (erroneous) hypothesis of speciation.”  For more, see:

  • Dillon, R. T., Jr.  (2011)  Robust shell phenotype is a local response to stream size in the genus Pleurocera. Malacologia 53:265-277. [pdf]
  • Dillon, R. T., S. J. Jacquemin & M. Pyron (2013)  Cryptic phenotypic plasticity in populations of the freshwater prosobranch snail, Pleurocera canaliculata.  Hydrobiologia 709: 117-127.  [pdf]
  • Dillon, R. T., Jr. (2014)  Cryptic phenotypic plasticity in populations of the North American freshwater gastropod, Pleurocera semicarinata.  Zoological Studies 53:31. [pdf]

Tuesday, November 2, 2021

Intrapopulation gene flow, the Leptoxis of the Cahaba, and the striking of matches

Editor’s Note – This essay was subsequently published as: Dillon, R.T., Jr. (2023b)  Intrapopulation gene flow, the Leptoxis of the Cahaba, and the striking of matches.  Pp 133 – 146 in The Freshwater Gastropods of North America Volume 6, Yankees at The Gap, and Other EssaysFWGNA Project, Charleston, SC.

Last month we reviewed a research project I conducted in the late 1970s on isolation-by-distance and barriers to dispersal in a population of Pleurocera proxima inhabiting a small stream in NW North Carolina [1].  The markers I used were allozyme variants – bands of protein migrating at different speeds in starch gels.  Even back in the 1970s, there was already a lot of hand-wringing about the genetic variation being missed by such a gross and clumsy technique.

I was missing, of course, all of the silent variation – variation due to the redundancy of the genetic code.  And of the non-redundant variation, mutations that yield variation in the amino-acid sequence, I was only catching a tiny fraction – that subset changing the charge on the protein.  And the technique I was using worked only on loci that encode enzymes, the evolution of which must certainly be constrained by selection, right?  What about junk DNA?  What about everything else? 

A lot of my colleagues worried about these problems in the 1970s.  And I can see why, if one invested in all that cumbersome equipment for protein electrophoresis, and all those expensive reagents to demonstrate allozyme bands, and conducted one’s field work, and ran one’s gels, and found no variation, and scraped one’s gels into one’s trash can, and washed one’s giant sink-full of dishes, one might grumble.

Allozyme variation in Naked Creek

But the grossness and clumsiness of allozyme electrophoresis never bothered me, through my entire career, even into the 21st century [5] because I did find allozyme variation.  With hard work, patience, and good technique, I found a lot of very useful genetic markers.  I realized that I was “binning” a bazillion silent variants together when I scored a snail homozygous for Odh106 back in 1979.  But I could distinguish those bazillion variants together from the bazillion silent variants I had binned together in snails I scored as homozygous Odh109F.  And those two big bins were inherited in Mendelian fashion.  Fine.

Well, technology marches on.  The first fully automated sequencing DNA machine came onto the market in 1987, even as Kerry Mullis’ patent for PCR amplification was approved, and by the 1990s everybody was sequencing DNA.  Massively-parallel (“Next-Generation”) DNA sequencing machines were introduced for commercial use around 2005, enabling rapid and cheap sequencing of gigabases of DNA.  And in 2008 a method was first proposed to identify single-nucleotide polymorphisms in random lengths of DNA amplified from population samples, “Restriction Associated DNA sequencing,” or RADseq for short.

The DNA from each individual (let’s say, for example, each snail) is isolated and cut into a bazillion little pieces with a carefully-chosen restriction enzyme or set of enzymes.  The millions of pieces in this mess that are (usually) a couple hundred base pairs long [6] are electrophoretically separated from the zillions of littler pieces and bigger hunks and ligated to adapters that facilitate their amplification and uniquely identify each individual snail.  These millions of pieces are called “reads.”  Feed all those reads through the front door of your local Next-Generation sequencing factory.

As mind-boggling as the previous paragraph most certainly is, I will now ask you to imagine repeating that process for (let’s say) 20 snails from (let’s say) 8 populations.  So 160 times.  And as mind-boggling as the preparation and the sequencing of all those 160 million reads most certainly is, I will now ask you to imagine that all of those reads can be “quality-filtered” to remove the crappy ones, screened by their utility as markers across the entire 160-individual population, and analytically matched to each other using some gargantuan gear-grinding smoke-belching computer program.  If you’re interested in the technical details, see the references at footnote [7] below.

What comes back out of the sequencing factory is, in our example, a comparison of 8 sets of 20 snails amplified at some huge number of random, anonymous (“restriction-site associated”) reads of DNA.  If there is any polymorphism, even for one single synonymous nucleotide, the researcher will know it.  The data are typically reported in tightly-packed bar graph form, standardized by the number of matching reads, coded by some color, let’s say orange to start.  If snail #1 and snail #2 are genetically identical, as far as can be determined by this mind-boggling technique, the bar graphs depicting their genomes will match in orange along 100% of their height.  If snail #1 and snail #2 differ by (let’s say) 40%, a second color is selected, let’s say blue, and the bar graph depicting snail #2 is 60/40 orange/blue.

So in 2019 our colleague Nathan Whelan, together with six coworkers, published the first RADseq study of a population of pleurocerid snails [8].  His results nicely augment and compliment the results I myself obtained using allozyme variants in the 1970s, and as such make an important contribution to our understanding freshwater gastropod evolution generally.

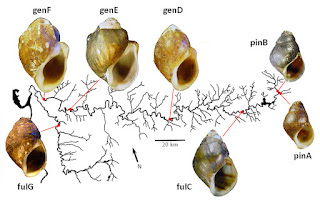
Whelan et al. Figure 2 [8]

Nathan collected samples of 20 Leptoxis from each of 8 sites in the Cahaba River drainage of central Alabama, stretching approximately 45 km (30 miles) from the Helena suburbs at County Road 52 (“CR52”) downstream to Centreville.  Four of his eight samples came from the main river, and four from the tributaries, as shown in his Figure 2 reproduced above.  This is a marvelously data-rich figure, from which those of us interested in pleurocerid evolution can learn at least four important lessons.  Let’s unpack each lesson, one at a time.

First, all eight of Nathan’s samples (let’s call them “subpopulations”) were genetically unique – some entirely unique, others just mostly unique.  I am not a fan of Nathan’s palate, but what he is trying to convey with his four shades of blue and four shades of orange is eight unique genomes associated with eight distinct Leptoxis subpopulations.  And the shade of orange 100% covering the Shades Creek box is completely different from the shade of orange 100% covering the Schultz Creek box.  And both of those oranges are completely different from the shade of blue 100% covering the CR52 box and the shade of blue 100% covering the Bulldog Bend box.  Those four subpopulations seem to be entirely unique, as far as Nathan’s data extend.  The other four subpopulations – Schultz Creek, Marvel Slab, Sixmile, and Centreville, are mostly unique, with other shades of color more or less impinging around the edges of their mostly-uniquely-colored box interiors.

Apparently, gene flow among most of Nathan’s subpopulations of Leptoxis is zero, at least on the time scale of single-nucleotide mutations.  That is the most surprising result of the 2019 study conducted by Whelan and colleagues.  All eight of their subpopulations are connected by water, with stepping-stone distances generally in the 10 – 30 km range.  The research we reviewed in September would have led us to expect slow but measurable active migration upstream, with rapid and episodic transport downstream [9].  My previous research on Pleurocera [1] suggested an average gene flow of 6.5 migrants among sites sampled 1 kilometer apart which, one would assume, ought to extend 10 km to some value greater than 0.0.  No?

The second important lesson conveyed by Nathan’s Figure 2 is that what little dribble of gene flow does occur among a few of his subpopulations seems to occur 100% downstream.  The four completely-unique subpopulations (Shades Creek, Schultz Creek, CR52, and Bulldog Bend) are from the four most upstream sites.  All four of Nathan’s downstream boxes show at least a little bit of upstream color.  One’s eye is especially drawn to the box at Nathan’s downstream-most subpopulation, Centreville, which is primarily painted dark blue, but demonstrates significant bars of NWR yellow, Schultz Creek dark orange, Shades Creek orange, Marvel Slab blue, and Bulldog blue.

More than any other pleurocerid, Leptoxis populations are strongly associated with rock substrate and rapid water flow.  Individuals of the genus Pleurocera, by contrast, are at least occasionally observed grazing across softer substrates.  This includes P. proxima, which although apparently adapted for small, trout-stream-sized creeks tumbling through the southern Appalachians, is not uncommonly spotted crawling on sand and firmer mud.  See the last photo I published in last month’s post [12Oct21].

But I can never, in my 60 years of field experience, ever remember collecting an individual Leptoxis on anything but rock.  So, Nathan’s eight Leptoxis subpopulations were collected from eight riffle areas that must (inevitably) have been separated by pool areas, with extensive bottoms of mud substrate.  Leptoxis can wash downstream through such pools but (apparently) cannot effectively crawl upstream through them.

Then how did Leptoxis get upstream in the first place?  The two answers to that question are great age + dirty birds.  While the lower regions of the Mobile Basin were yet covered by the Cretaceous embayment, the upper Mobile Basin had long been flowing free from the mountains of what is now North Georgia.  In 2009 I offered several lines of evidence suggesting that the pleurocerid populations of this region are “The Snails The Dinosaurs Saw,” living fossils of great antiquity [10].  I subsequently penned a series of essays showing that aerial dispersal among such populations is not as unlikely as one might think [11].

Whelan et al. Fig 1, modified [8]

And in 2016, Nathan together with our colleague Ellen Strong published a paper documenting extensive mitochondrial superheterogeneity among these same Cahaba River populations of Leptoxis for which he and his co-workers now report RADseq data [12].  Nathan’s 2016 results strongly imply very long periods of isolation, punctuated by very rare introductions of genomes from very great distances away.  Now in light of Nathan’s 2019 research findings, his 2016 paper makes more sense. 

The third important lesson to be taken from Nathan’s RADseq study is that divergence among Leptoxis subpopulations of the Cahaba is phenotypic, as well as genotypic.  The shells born by most of Nathan’s eight samples were almost entirely smooth, as shown in (B) of his Figure 1, modified above.  But the subpopulation inhabiting the Little Cahaba River below Sixmile Creek bears lightly tuberculate shells, typically with carination, as shown in (C).

In the figure below I have reproduced my diagram of Naked Creek from last month’s post and inset a slice of topographic map showing the Little Cahaba River between Bulldog Bend and Sixmile Creek.  These two maps are depicted at the same scale, see the Naked Creek scale bar at upper left.  The water distance from Bulldog to Sixmile is a serpentine 7.85 km (flowing from right to left), comparable to the distance between Naked Creek Site 7 and Naked Creek Site 8.

The Bulldog Bend box is 100% blue, demonstrating no gene flow from any other subpopulation sampled.  The Sixmile box is almost entirely orange but shows a bunch of little Bulldog-blue nibbles at the bottom, plus one big dramatic blue cut.  That singleton snail, the one individual whose genotype seems [13] to match Bulldog more than Sixmile, also bore a smooth shell (B) like the Bulldog subpopulation, not a tuberculate/carinate shell (C) like the other 19 in Nathan’s Sixmile sample.

Clearly this phenomenon is attributable to washdown gene flow from Bulldog to Sixmile.  The Smooth-Shelled Singleton in Nathan’s Sixmile Sample (Let’s call him “5S.”) did not demonstrate a 100% Bulldog genome, however, but rather only about 50% [13] matching Bulldog.  The implication is that Snail 5S is not a first-generation washdown, but a second generation washdown, born at Sixmile but retaining the shell morphology along with half the genome of a Bulldog parent.  This is indirect but nevertheless compelling evidence for the heritability of tuberculate/carinate shell morphology in pleurocerid snails.  But wait, there’s more.

The final lesson from Nathan’s RADseq study, and the most important lesson, is this.  Although these eight subpopulations have diverged both genetically and morphologically, they have not speciated.  The isolation between them is physical, not reproductive.  When snails wash down, albeit rarely, they are apparently able interbreed freely with the snails in the riffles downstream.  The Cahaba River at Centreville is not populated by an admixture of five different Leptoxis species.  All 20 of the snails Nathan collected at Centreville belonged to the same biological species as the seven subpopulations Nathan sampled upstream.

Nathan identified all eight of his subpopulations as “Leptoxis ampla.”  OK, that’s a good start.  We all agree on the conspecific status all the Leptoxis subpopulations of the Cahaba.  Now let us see if we can apply the lessons we have learned in the Cahaba to the greater Mobile Basin beyond.

I have reviewed the tangled taxonomic history of the Mobile Basin Leptoxis fauna on several occasions in the tangled epistemological history of the FWGNA blog [15].  But not recently.  So to refresh the collective memory.

Timothy Abbot Conrad got the ball rolling back in 1834, describing four species, two from the Alabama/Coosa and two from the Black Warrior.  Isaac Lea [16] added seven, J. G. Anthony added three, H. H. Smith added eleven, and Calvin Goodrich [17] one, so that by 1922, Goodrich tallied 26 nominal species of Leptoxis in drainages of the Mobile Basin [18].  I reproduced Goodrich’s figure of all 26 in my essay of [15Sept09] and have re-reproduced it below.

Most of these nominal species were nominally-extincted by extensive damming and impoundment conducted throughout the Mobile Basin, starting in 1912, accelerating in the 1920s and 1930s, and continuing into the 1960s.  By the 1990s, Goodrich’s Leptoxis list had been reduced to four nominal species, each inhabiting small fragments of its former range: L. picta (Conrad 1834) in the main Alabama River, L. ampla (Anthony 1855) in the Cahaba, L. taeniata (Conrad 1834) in the lower reaches of three creeks in the Coosa drainage, and L. plicata (Conrad 1834) in the Black Warrior.

Goodrich [18]
How many of these might be biologically valid?  In 1998 I published a paper with Chuck Lydeard [19], reporting that the allozyme divergence among L. picta, L. ampla, and L. taeniata was no greater than the allozyme divergence among a set of conspecific Leptoxis praerosa controls sampled from equally-distant quarters of Tennessee [20].  We suggested that ampla and taeniata be synonymized under picta (Conrad 1834).

Modern fashion has trended in the other direction, however.  Even as our 1998 paper was in review, a pleurocerid population identified as “Leptoxis downei” was discovered in the Oostanaula River of Georgia, a nomen subsequently dropped in favor of L. foremani.  And in 2011 a population identified as Leptoxis compacta was discovered in the Cahaba River at the Shades Creek confluence, sympatric with snails Nathan identifies as L. ampla [21].  Today the list of nominal Leptoxis species inhabiting the Mobil Basin has rebounded to six [22].

Now research results have crossed our desk demonstrating that the Leptoxis population of the Cahaba River is strikingly fragmented into subpopulations, that these subpopulations have diverged both genetically and morphologically, and that they have not speciated.  Another 50 km downstream will bring us to the main Alabama River, and 100 km back up the Alabama/Coosa will bring us to the mouth of Buxahatchee Creek.  Does this new evidence support the assignment of three different specific nomina to “Leptoxis ampla” in the Cahaba, “L. picta” in the main river, and “L. taeniata” in Coosa tributaries such as Buxahatchee Ck?

Forty years ago, while I was yet a doe-eyed graduate student, it was clear to me that the key to understanding speciation was to understand population divergence, and the key to understanding population divergence was to understand intrapopulation gene flow.  I did not have any big grants, and I did not have any fancy tools, and I did not have legions of collaborators.  But I did have, even at that tender age, quite a few years of field observation on the biology of pleurocerid populations in rivers of the American southeast, and an openness to learn more, and that took me a long way.

Now I am delighted to discover colleagues in Alabama bringing sophisticated tools to bear on questions I myself pondered in my youth.  Can my colleagues extend their newfound understanding of intrapopulation gene flow forward through population divergence and generalize to the species level?  Can they bring dawn to the darkness that has enveloped the pleurocerid fauna of the Mobile Basin for 200 years?  That remains to be seen.  But Nathan Whelan and his colleagues have struck the first match.


Notes 

[1] My research project on gene flow in the Naked Creek population of Pleurocera proxima was ultimately published in three different ways.  The 1979 results, in their entirety, were published as Chapter 2 of my 1982 dissertation [2].  The barrier-to-dispersal portion of that 1979 study was combined with data from 1980 and 1985 and published in 1988 [3].  The isolation-by-distance portion of my 1979 study was published just last year in Ellipsaria [4].  For an overview of the entire research program, see last month’s post:

  • Intrapopulation gene flow: The polymorphic Pleurocera of Naked Creek [12Oct21]

[2] Dillon, R.T. Jr (1982)  The correlates of divergence in isolated populations of the freshwater snail, Goniobasis proxima.  Ph.D. Dissertation, University of Pennsylvania. 182 pp.  Dissertation Abstracts 43: 615B

[3] Dillon, R.T., Jr. (1988) The influence of minor human disturbance on biochemical variation in a population of freshwater snails. Biological Conservation 43: 137-144.  [PDF]

[4] Dillon, R. T. (2020) Fine scale genetic variation in a population of freshwater snails. Ellipsaria 22(1): 24 - 25.  [PDF]

[5] I was still frantically running allozyme gels when I was kicked out of my lab at the College of Charleston in the spring of 2016.  And still getting interesting results, too!  See:

  • The best estimate of the effective size of a gastropod population, of any sort, ever [14Jan19]

[6] Actually, Nathan and his colleagues used a clever modification called 2b-RADseq, involving a special restriction enzyme called ALF1, that cuts DNA into fragments exactly 36 bp long.

[7] A few of the better references on RADseq:

  • Baird N, Etter P, Atwood T, et al. (2008) Rapid SNP Discovery and Genetic Mapping Using Sequenced RAD Markers. PLoS ONE 3:e3376.
  • Davey, JW & M.L Blaxter (2010) RADSeq: next-generation population genetics.  Briefings in Functional Genomics 9: 416-423. doi: 10.1093/bfgp/elq031
  • Rubin, B.E.R., R.H. Ree, and C.S. Moreau (2012)  Inferring phylogenies from RAD sequence data.  Plos One 7(4): e33394.
  • Wang, S, E. Meyer, J.K. McKay, and M. Matz (2012)  2b-RAD: A simple and flexible method for genome-wide genotyping.  Nature Methods 9: 808 – 810.

[8] Whelan, N.V., M.P. Galaska, B.N. Sipley, J.M. Weber, P.D. Johnson, K.M. Halanych, and B.S. Helms (2019)  Riverscape genetic variation, migration patterns, and morphological variation of the threatened Round Rocksnail, Leptoxis ampla.  Molecular Ecology 28: 1593 – 1610.

[9] For a review of previous research on this important topic, see:

  • Intrapopulation gene flow: King Arthur’s lesson [7Sept21]

[10] Dillon, R.T., Jr. and J.D. Robinson (2009)  The snails the dinosaurs saw: are the pleurocerid populations of the Older Appalachians a relict of the Paleozoic Era?  Journal of the North American Benthological Society 28: 1 – 11 [PDF].  For more, see:

  • The snails the dinosaurs saw [16Mar09]

[11]  My four-part series on aerial dispersal:

  • Freshwater gastropods take to the air, 1991 [15Dec16]
  • A previously missed symbiosis? [11Jan17]
  • Accelerating the snail’s pace 2012 [24Apr17]
  • Freshwater snails and Passerine Birds [26May17]

[12] Whelan, N.V. & E. E. Strong (2016)  Morphology, molecules and taxonomy: extreme incongruence in pleurocerids (Gastropoda, Cerithiodea, Pleuroceridae). Zoologica Scripta 45: 62 – 87. For an independent analysis of these fascinating results, see:

  • Mitochondrial superheterogeneity: What we know [15Mar16]
  • Mitochondrial superheterogeneity: What it means [6Apr16]
  • Mitochondrial superheterogeneity and speciation [3May16]

[13] The singleton blue streak in the orange Sixmile box seems to slice much more than halfway through.  Possibly 75 – 80%?  I feel sure that’s just slop [14].  If a snail collected at Sixmile doesn’t bear 100% of the Bulldog genome, it must bear 50% or less.

[14] The only other explanation would be that Snail 5S has one parent and one grandparent washed down from Bulldog.  In other words, the mother of 5S washed down from Bulldog and was inseminated by a father with one parent born at Bulldog, yielding Snail 5S, with 75% Bulldog genome. 

That scenario seems quite unlikely.  The proportion of first-generation Bulldog-washdowns at Sixmile seems to be less than 1/20 = 0.05, and the proportion of second-generation washdowns approximately 1/20 = 0.05, so the likelihood of a first-generation x second-generation mating must be less than 0.05^2 = 0.0025. 

The implication of the highly-unlikely scenario outlined above would be that the father of Snail 5S actively sought the mother of 5S.  In other words, there is some sort of reproductive isolation between the Bulldog and Sixmile Leptoxis populations.  The two populations have speciated.

Might a unique species of Leptoxis have evolved on the Sixmile rapids in the middle of the Cahaba? Nah.  Just look downstream at Centreville.  I count six snails bearing hunks of Sixmile genome together with native Centreville genome, upstream Schultz Creek genome, and everything else.  So I agree with Nathan on this one.  The apparent excess in the length of that skinny blue cut in the orange Sixmile box is almost certainly just slop.

[15] For additional background on the taxonomy of Leptoxis populations in the Mobile Basin:

  • Mobile Basin I: Two pleurocerids proposed for listing [24Aug09]
  • Mobile Basin II: Leptoxis lessons [15Sept09]

[16] For the record:

  • Isaac Lea Drives Me Nuts [5Nov19]

[17] Actually, if you’re digging around in these footnotes for more homework, I would recommend reading my 2007 biographical sketch of Calvin Goodrich before reading the two Mobile Basin essays I posted in 2009.  Start here:

  • The Legacy of Calvin Goodrich [23Jan07]

[18] Goodrich, C. (1922) The Anculosae of the Alabama River Drainage.  University of Michigan Museum of Zoology Miscellaneous Publication 7: 1 – 57.

[19] Dillon, R.T., and C. Lydeard (1998) Divergence among Mobile Basin populations of the pleurocerid snail genus, Leptoxis, estimated by allozyme electrophoresis.  Malacologia. 39: 111-119. [PDF]

[20] Leptoxis plicata populations of the Black Warrior appear to be genetically distinct.

[21] Whelan, N.V. P.D. Johnson and P.M. Harris (2012)  Rediscovery of Leptoxis compacta (Anthony 1854) (Gastropoda: Cerithioidea: Pleuroceridae)  PlosOne 7(8) e42499 [html]

[22] Shelton-Nix, E. (2017)  Alabama Wildlife, Volume 5.  University of Alabama Press, Tuscaloosa. 355 pp.

Tuesday, October 12, 2021

Intrapopulation gene flow: The polymorphic Pleurocera of Naked Creek

Editor’s Notes.  The research results reported below were originally published in my 1982 dissertation [1], extracted for Biological Conservation back in 1988 [2], and more completely published in the FMCS Newsletter Ellipsaria just last year [3], if you are looking for something citable.  They were subsequently published as: Dillon, R.T., Jr. (2023b)  Intrapopulation Gene Flow: The polumorphic Pleurocera of Naked Creek.  Pp 121 – 131 in The Freshwater Gastropods of North America Volume 6, Yankees at The Gap, and Other EssaysFWGNA Project, Charleston, SC.

Last month we left our hard-working graduate student in his carrel at the University of Pennsylvania library, xeroxing manila-folders-full of references on intrapopulation dispersal in freshwater gastropods [4].  And planning, as he did, his own study to see if gene flow of such slow tempo but inexorable advance might be sufficient to maintain panmixia in populations of his own favorite study organism, Pleurocera (Goniobasis) proxima, in streams of the southern Appalachians.

I already had a great study site in mind.  In the fall of 1978, I had conducted a preliminary survey of allozyme variation in pleurocerid populations across a 100 km swath of the Virginia / North Carolina border using old-style starch gel electrophoresis [5].  Almost all 12 of the populations I surveyed were almost all homozygous at almost all allozyme loci.  But I did find one population of P. proxima inhabiting a small tributary of the Yadkin River in NW North Carolina demonstrating four alleles at the octopine dehydrogenase locus (Odh) and two alleles at the mannose-phosphate isomerase locus (Mpi).

Naked Creek culvert, 1980
Naked Creek runs under what is now called “Rom Eller Road” where I had first stooped to sample it in 1978 (36.1426, -81.3586).  By that date, the corrugated metal culvert through which the creek passes had been installed for perhaps 25 years [6] and had been undercut, forming a little waterfall.  I noticed an exceptionally high density of P. proxima crawling around in circles in the pool below that culvert, apparently unable to pass upstream.  It was my impression that this culvert constituted a significant barrier to intrapopulation dispersal.  Might some genetic consequences have already evolved?

So, in May of 1979 I laid out the sampling scheme shown in the figure below [7], focusing on the Rom Eller Road culvert (between sites 2 and 3) but extending down Naked Creek to the point where population densities dwindled to negligible below site 7 [8].  Then I went downstream a bit further and up an unnamed side branch to the point where population densities picked up again, and sampled site 8.  And then I went way downstream yet further, back up the South Prong of Lewis Fork, and sampled at site 9. 

Notice that site 9 is geographically quite near site 1, implying environmental similarity, and hence little selection for divergence, but quite distant through water, implying little gene flow.  Exploitation of such decoupling between geographic distance and environmental difference, across a rugged three-state slice of the Southern Appalachians, was to be the main theme of my dissertation [1].  But back to Naked Creek, and May of 1979.

From each of my nine sites I collected quantitative samples by methods that varied according to snail density.  For high density sites upstream, I used a one-square-foot Surber sampler, and for low density sites further downstream, I laid out one-meter transects and collected every snail within.  The total area sampled was generally inhabited by several hundred snails.

I subsampled approximately 30 snails from each site and examined them for genetic variation at 16 allozyme-encoding loci.  The only polymorphisms I discovered were the two I already knew about: Odh and Mpi.  For those two loci, I upped my sample sizes to 100ish.

The first step of my analysis was a test for the significance of genetic variation among the Surber samples, or among the transects, I had collected within the nine sites.  Finding none, all samples within-sites were pooled.  The second step of my analysis was to test for Hardy-Weinberg equilibrium.  And strangely, perhaps alarmingly, I discovered significant deficits of heterozygotes in most of my samples pooled within sites.  This made me wonder if the inheritance of those allozyme bands might be non-Mendelian [9]?  Null alleles, perhaps?  Put a bookmark here, we’ll come back to those questions in about four paragraphs.

Graphed on the left axis below are gene frequencies for three of the four Odh alleles I resolved from the 7 sites I sampled on Naked Creek (proper) in May of 1979: 106, 109F and 113f [7].  The fourth allele (111) was rare, less than 0.05 at all sites, and is ungraphed.  Graphed on the right axis is log snail density, which dipped from an impressive 293 per square meter at site 1 down to 8.6 per square meter just above the culvert at site 2 and jumped back to an eye-popping 1,127 per square meter directly below the culvert at site 3.

Focusing first on the 10 meters of stream between sites 2 and 3.  Although the graph below does not evince especially striking variation in the frequencies of the most common allele, Odh106, the jump in Odh 113F at the expense of Odh109F between sites 2 and 3 was significant at the 0.05 level.  This is clear evidence of a barrier to dispersal, much like rocky rapids served as a barrier to the dispersal in Bovbjerg’s population of Campeloma [4].  It is hard to escape the conclusion that the evolution of the Naked Creek population of Pleurocera proxima has indeed been directly affected by a corrugated metal pipe.

Further downstream, we see evidence of isolation by distance.  Although Odh106 remained the most common allele down the 5 km length of stream inhabited by P. proxima, the frequency of Odh109F continued to increase at the expense of Odh113F, such that Odh109F became the second-most common allele at site 7.  As far as I can tell, there are no waterfalls or other barriers to dispersal in that section of the stream.  Nevertheless, the Odh allele frequency differences among all downstream sites 3 – 7 were also significant.

Now back to that bookmark.  When individual sampled from nonrandomly breeding subpopulations are combined, the resulting heterozygote deficit has been termed a “Wahlund Effect.”  Normally Wahlund Effects are observed in samples pooled across overly-large distances, and they warn a population geneticist that he must reduce his sampling area.  Pooling all seven of my Naked Creek sites down the entire 5 km length of the P. proxima population, Wahlund Effects are to be expected.  But (you remember) I found significant heterozygote deficits within sites, not just between them.  No individual sampling area at any site was larger than 10 – 20 square meters of stream bottom, and some were much less.  Yet significant heterozygote deficiencies within sites persisted.

I would suggest that my 1979 observations are consistent with a “Wahlund Effect in time,” rather than in space.  Within-site heterozygote deficiencies may be attributable to the migration of the snails themselves.  Populations of P. proxima in this part of the world demonstrate a two-year generation time – eggs laid in the early spring hatch into tiny juveniles which crawl upstream for (perhaps) 18 months, mating their second fall, continuing to crawl upstream, laying their first eggs in their second spring.  And adults can live quite a few years beyond maturity, continuing to crawl upstream, continuing to lay eggs.  Thus, snails are born (at least) two years upstream from where their parents were born, and possibly further.  When I dropped my Surbur sampler in Naked Creek and collected a mixture of one-year-olds and two-year-olds and three-year-olds, and so forth, I was sampling a much longer section of stream bed than I imagined.

Deviations from Hardy-Weinberg expectation are conventionally quantified with the inbreeding coefficient, F.  In 1978 Sewall Wright [10] proposed a method by which the total deviation from Hardy-Weinberg expectation in a sample taken from several subpopulations (which he called FIT) can be partitioned into two components: the deviation within subpopulations (FIS – presumably due to factors such as inbreeding, assortative mating, and so forth) and the deviation between subpopulations (FST – due to isolation by distance, barriers to dispersal, and so forth).  This latter component of the inbreeding coefficient F may be used as an indirect measure of average gene flow between subpopulations.

So setting aside sites 1 and 2, which we strongly suspect are isolated by a barrier to dispersal, the values of Wright’s statistics across sites 3, 4, 5, 6, and 7 are FIT = 0.388, FIS = 0.365, and FST = 0.013 [11].  It would appear that almost all of the deviation from Hardy-Weinberg equilibrium I recorded in the P. proxima population of Naked Creek is due to within-site factors, Wahlund Effects in time, not space.

But that little between-site value, FST = 0.013, is nevertheless highly significant [12].  Sites 3 - 7 are all spaced approximately 1 km apart and arranged linearly in what has been called "stepping stone" fashion [13], migrants being exchanged by adjacent populations only.  In such situations, Slatkin & Barton [14] have suggested a method by which values of FST can be converted to a statistic called “Nm,” the average number of migrants moving among subpopulations per generation.  An FST value of 0.013 implies that the average number of P. proxima moving 1 km per generation in Naked Creek is approximately Nm = 6.5.

Now let’s take another step back and turn our attention to the P. proxima populations inhabiting Sites 8 and 9, apparently isolated from the Naked Creek population by uninhabited waters.  Both populations show highly significant differences at the Odh locus [15], missing Odh113F entirely, as well as the (rare) Odh111.

P. proxima in Naked Creek
The P. proxima population inhabiting site 9 was also missing the second allele at the mannose-phosphate isomerase locus, a highly significant difference.  I have omitted the Mpi results I gathered back in 1979 from my discussion thus far, because no significant differences were apparent in samples 1 – 8.  But the sample I took approximately 1.5 km further downstream in Naked Creek and another 6 km back up the South Prong of Lewis Fork was both the most geographically distant and the most genetically divergent.  Further exploration of the correlation between geographic distance and genetic difference in P. proxima was the direction the remainder of my dissertation research was ultimately to take.

But my Naked Creek studies did not end in May of 1979.  For in August, I once again found myself in Wilkes County, NC, driving down Rom Eller Road.  And I was surprised to discover that the owner of the property directly above the culvert had bulldozed and cleared several acres for a house trailer.  Ensuing rains had eroded the newly-exposed soils into the creek, which by August had settled in the pool at Site 3, and apparently allowed thousands of snails to pass upstream.

So in May of 1980 I returned for a second year of sampling, focused only on the area around the Rom Eller Road culvert, and just on allele frequencies at the Odh locus.  By that date the sediment had cleared from Naked Creek, and the waterfall reestablished.  The photo that opened this essay way up above was actually taken in May of 1980, not May of 1979, and shows the recently-cleared land directly upstream, with new grass growing.

I resampled 100 snails from sites 1, 2 and 3 in 1980, and added a fourth site approximately 500 m downstream from site 3 [7].  And I was not surprised to discover that the Odh allele frequencies across the Rom Eller Road culvert had equilibrated.  And I returned yet again in May of 1985 for a third set of samples around the Rom Eller Road culvert.  And five years after perturbation, the same significant bump in Odh113F (at the expense of Odh109F) that I had observed in 1979 had become reestablished [16].  I published a paper reporting just my results around the Rom Eller Road culvert in 1988 [2] and left the remainder of the results from my 1979 survey to languish in my dissertation for 40 years, until just last year [3].

So the answer to the question with which I closed my essay last month is, no.  Gradual migration upstream plus episodic migration downstream are not, apparently, sufficient to maintain panmixia in Pleurocera proxima populations.  And this month I will leave you with another question, which I will not promise to answer any time soon [17].  Given the great difficulty P. proxima obviously manifest in negotiating even 12-inch waterfalls, the achingly-slow rates at which they disperse upstream even if unobstructed, and no evidence of downstream dispersal between isolated populations whatsoever,  how in the Haich-Ye-Double-Hockey-Sticks has this snail spread 500 km from southern Virginia to North Georgia on both sides of the rugged Appalachian divide?


Notes

[1] Dillon, R.T. Jr (1982)  The correlates of divergence in isolated populations of the freshwater snail, Goniobasis proxima.  Ph.D. Dissertation, University of Pennsylvania. 182 pp.  Dissertation Abstracts 43: 615B

[2] Dillon, R.T., Jr. (1988) The influence of minor human disturbance on biochemical variation in a population of freshwater snails. Biological Conservation 43: 137-144.  [PDF]

[3] Dillon, R. T. (2020) Fine scale genetic variation in a population of freshwater snails. Ellipsaria 22(1): 24 - 25.  [PDF]

[4] To contextualize the research results reported here, it might help the reader to be familiar with last month’s essay:

  • Intrapopulation gene flow: King Arthur’s lesson [7Sept21]

[5] Dillon, R.T. and G.M. Davis (1980) The Goniobasis of southern Virginia and northwestern North Carolina: Genetic and shell morphometric relationships. Malacologia 20: 83-98. [PDF]

[6] I interviewed the District Engineer by telephone in 1985, and it was his best estimate that Rom Eller Road had initially been improved and paved "in the early 1950's."

[7] Neither the site numbers nor the allele numbers I am using for this essay are those that I originally used in Chapter 2 of my 1982 dissertation.  I followed up my 1979 study with a second survey in 1980, and a third in 1985, and added some sites and removed others, and continued to discover new allozyme alleles as my dissertation progressed across the southern Appalachians,  the numbering systems evolved.  I actually made a fresh start on the site numbering systems for the note I published in Ellipsaria in 2020 [3], which I am following here.

[8] The inverse correlation between stream size and population density in P. proxima was already well-documented when I started my research program.  The phenomenon is striking all over the Southern Appalachians, from Virginia to North Georgia.  Pleurocera populations often reach into the hundreds per square meter in the smallest creeks, thrive in trout-sized streams, and dwindle to negligible in bass-sized rivers.  It looks as though they are crawling over one another in a relentless race to the mountaintops.  See:

  • Crutchfield, P.J. (1966) Positive rheotaxis in Goniobasis proxima. Nautilus, 79:80-86.
  • Foin, T.C. & A.E. Stiven (1970)  The relationship of environment size and population parameters in Oxytrema proxima (Say) (Gastropoda: Pleuroceridae).  Oecologia (Berl.) 5:74-84.

[9]  I ultimately confirmed Mendelian inheritance at the Odh locus in a series of breeding experiments I conducted several years later.  See:

  • Dillon, R.T. (1986) Inheritance of isozyme phenotype at three loci in the freshwater snail, Goniobasis proxima: Mother-offspring analysis and an artificial introduction. Biochemical Genetics 24: 281-290.  [PDF]

[10] Wright, S. (1978)  Evolution and the Genetics of Populations.  Volume 4, Variability within and among natural populations.  University of Chicago Press.

[11] To calculate my values of F I used the subroutine “FSTAT” in Swofford & Selander’s BIOSYS-1.  See:

  • Swofford, D.L., and R.B. Selander (1981)  BIOSYS-1: A FORTRAN program for the comprehensive analysis of electrophoretic data in population genetics and systematics.  Journal of Heredity 72: 281 – 283.

[12] The significance of a value of FST based on a single locus can be estimated using a chi-square test.  See:

  • Workman, P.L. and J.D. Niswander (1970)  Population studies on southwestern Indian tribes.  II. Local genetic differentiation in the Papago.  Am J Hum Genet 22: 24 – 49.

With N=500 snails, s = 5 populations and k=4 alleles, a value FST = 0.013 is highly significant (X2 = 111.0, 12 df).

[13] Kimura, M. and G.H. Weiss (1964)  The stepping stone model of population structure and the decrease of genetic correlation with distance.  Genetics 49: 561 – 576.

[14] Slatkin, M. and N.H. Barton (1989)  A comparison of three indirect methods for estimating average levels of gene flow.  Evolution 43: 1349 – 1368.

[15] Assuming the mean frequency of 24% demonstrated by allele 113F in Naked Creek, the binomial probability of drawing no individuals bearing Odh 113F in 29 attempts, as in Site 8, is 5 x 10^-6.

[16] It seems quaint today, but there was a time in the history of evolutionary biology when observations such as those I made at the Naked Creek culvert 1979 – 1985 might have been interpreted as evidence for natural selection.  My mentor, Arthur Cain, certainly thought so.  Although conscious of the evolutionary effects of barriers to dispersal in his chosen model, the land snail Cepaea nemoralis, he interpreted even very small-scale variance in the frequencies of shell color genes as adaptation to very local selective pressures.  My 1985 observation that gene frequencies returned to their 1979 values after perturbation in 1980 is consistent with some sort of selective differential across the Naked Creek culvert.  Arthur Cain would have hastened to point that out.  Worth a footnote today, I suppose.

[17] But I do have an hypothesis, which I called the “jet-lagged wildebison” model of gene flow in pleurocerid populations.  See:

  • Mitochondrial superheterogeneity: What it means [6Apr16]

Tuesday, September 7, 2021

Intrapopulation gene flow: King Arthur's lesson

Editor’s Note – This essay was subsequently published as: Dillon, R.T., Jr. (2023b)  Intrapopulation gene flow: King Arthur's lesson.  Pp 111 – 120 in The Freshwater Gastropods of North America Volume 6, Yankees at The Gap, and Other EssaysFWGNA Project, Charleston, SC.

A frequent visitor to the Malacology Department at Academy of Natural Sciences, during the sweet gauzy years of my graduate education in Philadelphia, was a charming scholar of aristocratic bearing named Prof. Arthur J. Cain [1].  Prof. Cain made his reputation on the study of color polymorphism in the European land snail Cepaea, publishing several very influential papers on the subject in the 1950s and early 1960s [2].  He was a wellspring of stories about E.B. Ford and the good old days of “Ecological Genetics,” stomping about the English countryside, collecting data on the frequencies of the myriad color morphs of Cepaea and their correlation with temperature, ground cover, predation, and so forth [3]

Arthur J. Cain (1921 - 1999)
King Arthur once remarked, “Since the term was coined by the founding fathers of the modern synthesis – I don’t know by whom, and it does not matter – nobody has ever imagined that the concept of panmixia might apply to a natural population of gastropods.”

So I had arrived in graduate school knowing that I wanted to focus my research on the phenomenon of speciation in freshwater snails.  And it was crystal clear to me that in order to understand speciation, I had to understand population divergence.  And before I could understand population divergence, I had to understand genetic variation within populations.  And in order to understand genetic variation within populations, I had to understand all those things that Arthur Cain loved to talk about – barriers to dispersal, isolation-by-distance, gene flow and the lack thereof.  In short, why freshwater gastropod populations are not panmictic.  That was the first thing [4].

Like a good student, I started in the library.  The literature on intrapopulation gastropod dispersal was mind-bendingly huge, even when I first dug into it in the late 1970s.  So I focused on the movement of freshwater gastropods in lotic environments, which was the most directly relevant to my research interest in pleurocerid populations in the Southern Appalachians.  And the first impression I got was the universal tendency for freshwater snails to actively disperse upstream, into currents.  And the second impression I got was the equally-universal likelihood of passive dispersal downstream, by wash-down.  Both of these phenomena are functions of current speed.

The oldest paper in the yellowing folder I still have filed under “Intrapopulation Dispersal” in the cabinet to the right of my desk also turned out to be among the most relevant to my subsequent dissertation research with Pleurocera (“Goniobasis”) proxima – a 1952 study of the Campeloma population inhabiting a small creek in Michigan.  Bovbjerg [5] observed striking aggregations of his large-bodied, burrowing study organism downstream from rocky riffles, which they seemed to have difficulty traversing.  His mark-release study, conducted over six days in a long, sandy region without such obstructions, returned a (surprisingly high) mean upstream dispersal rate of 350 cm per day OTSIWATFA [6], with no downstream dispersal whatsoever.

So the increased population densities Bovbjerg observed downstream from riffles would seem to be consistent with the opposite of dispersal… a barrier, right?  Exactly analogous to the grassy fields and gravel roads that Arthur Cain and the ecological geneticists focused so much of their attention upon in the English countryside, yes?  Back in 1978, I marked Bovbjerg’s paper with a little yellow sticky-tab.
On your mark!  Get set...

Marked with an orange sticky-tab in my intrapopulation dispersal file was a section from the 1978 dissertation of Mancini, involving a Pleurocera (“Goniobasis”) semicarinata population inhabiting a small Indiana stream [7].  Between September 1974 and January 1976, Mancini performed 10 release experiments, each two months in duration, involving 100 marked snails.  The fourth and fifth columns of the author’s Table 7 (reproduced below) show net migration, combining both upstream and downstream movement.  The mean over all five summer values was a modest 4.0 cm per day net upstream movement OTSIWATFA, and the winter mean a very modest +1.9 cm per day.

At the top of my intrapopulation dispersal stack, marked with a red sticky-tab, was the 1966 study of Crutchfield [9] on the Pleurocera proxima population of a North Carolina stream – the same study organism I had targeted for my own dissertation research, in exactly the same environment.  His was a single-release study of 15 week’s duration, between late December and early April of 1958.  Of the 53 snails Crutchfield marked in December, only 5 could be relocated in April, a result the author correlated to rains and high water.  All five snails had moved upstream, at a median distance of 55 feet (16.0 cm/d OTSIWATFA), ranging from 20 feet (5.8 cm/d) to “>100” feet (>29 cm/d)

Perhaps unsurprisingly, however, the best studies of freshwater gastropod dispersal published (as of my years in graduate school) focused on the medically-important planorbid Biomphalaria [10].  Adult Biomphalaria are adapted for lentic waters, not lotic, bearing clunky, bulbous shells typically enfolding an air bubble.  But the mark-release experiments of Paulini (for example), conducted in a ditch with a gentle current of 10 cm/sec, yielded a mean upstream dispersal rate of 130 cm/day OTSIWATFA.  After 6 days, the population mode was 15 meters upstream from Paulini’s release point.

In higher currents, the likelihood of dislodgement seems to become quite significant in Biomphalaria.  Pimentel’s mark-release experiment in a rapid Puerto Rican stream returned a net downstream transport that initially averaged 55 cm/day OTSIWATFA, as against only 36 cm/day upstream, for his first week of observation.  The same downstream-bias continued until observations ended at day 42, although at about half the initial rate.

The most refined study of freshwater gastropod dislodgement of which I am aware is Dussart’s [11] comparison of Biomphalaria with six other pulmonates, conducted in a transparent pipe.  He introduced each snail into a gentle current, allowing them to crawl directly on the PVC walls, and (of course) they all oriented upstream.  Gradually increasing the flow rate, he recorded the time at which each snail became dislodged and calculated a peculiar statistic (cubic centimeter minutes) measuring the total flow to which each snail had been exposed.  The most important variable predicting mean detachment flow (in cc.m) turned out to be profile area of the shell, rather than overall mass or foot size.

From Mancini [7]

One of the more memorable field experiences of my undergraduate education at Virginia Tech took place over the 24 hours I spent with a graduate student named Jim Kennedy sampling macroinvertebrate drift from the New River bridge in Fries, Virginia.  Jim had rigged a battery of plankton nets to suspend in the water column under the bridge, and we checked them every hour through one very cold winter afternoon in 1977, the night, and the morning that followed. 

Freshwater gastropods are recovered from such nets at a surprisingly high frequency.  The most spectacular case of which I am aware was documented by P. C. Marsh [12], working in a small Minnesota Creek draining 17.6 square kilometers of extensively-ditched agricultural lands.  Marsh reported collecting at least a few Physa [13] in his drift nets at each of 10 sampling periods over the course of 20 months.  Heavy rains and high discharge seem to have been responsible for a peak mean of 326 snails/net/day on one sample Marsh collected in early April. 

But in late May a second peak in snail count was observed, this unaccompanied by rain.  Marsh’s average catch of 1,398 snails/net/day translated to an eye-popping 533,000 snails/cubic meter discharge/second, averaged over the entire day of observation.  This figure represented at that time (and may still be) the highest macroinvertebrate biomass ever documented from stream drift sampling.  Marsh speculated that this drift even may have been triggered by crowding and competition in the rapidly-growing Physa population upstream.

Marsh’s literature review found three studies of macroinvertebrate drift published between 1944 – 1980 containing quantitative data on gastropods [14].  Sitting in my carrel at the University of Pennsylvania Library, I was able to add a 1981 paper by Waters [15] and an excellent study by McKillop and Harrison [16] on the Caribbean Island of St Lucia, published in 1982.

New River Bridge at Fries, VA [17]

McKillop and Harrison positioned standard dip nets at the outfalls of several small, enclosed dasheen (or taro) marshes, recording total captures at 06:00 and 18:00 hours for 11 days during the month of April [19].  Summing all 11 samples taken at 18:00 hours, the authors recorded 29 individual Biomphalaria glabrata and 40 individuals of the little hydrobioid Pyrgophorus parvulus.  Totaled across all samples drawn at 06:00, McKillop and Harrison tallied 59 B. glabrata and 114 P. parvulus.  The authors compared the size frequency distributions of drifting Biomphalaria and Pyrgophorus to those of the resident populations and found that drift contained significantly increased frequencies of the smallest size classes.

The data of McKillop and Harrison demonstrate one of the best-documented characteristics of macroinvertebrate drift, diel periodicity.  At night, especially on the new moon, stream organisms actively enter the water column at an increased frequency.  So as was the case with the Physa population in the Minnesota ditches, the data of McKillop & Harrison suggest that at least some of the Biomphalaria and Pyrgophorus inhabiting St. Lucia marshes intentionally release into the water currents.

For eleven years, ecology students at the University of Cape Town, South Africa [20] sampled five sites along the 11 km Liesbeek River nearby.  The first two sites were near the mountainous source of the river, showing average March current velocities of 61 cm/sec and 47 cm/sec.  Sites 3, 4, and 5 were approaching the coast, with average March current speeds of 41, 30, and 13 cm/s, respectively.  The students first collected invasive Physa acuta at site 5 in 1979.  By 1980 the population had spread 3.1 km upstream to site 4, and in 1981 it first appeared at site 3, another 1.8 km upstream.  Thus, over two years, P. acuta displayed a minimum net upstream movement of 4.9 km, or 671 cm/d.  Active dispersal cannot account for such a pace.

The Physa population became established at sites 3, 4, and 5 over the next seven years, in some places reaching densities in the hundreds per square meter, but as of 1988 had not spread upstream to site 2.  These observations are all consistent with an hypothesis that the Liesbeek River Physa population has relied on avian transport, bait bucket hitchhiking, or some similarly passive agency for upstream dispersal.  My readership is referred back to my 2016-17 series of essays on the arial dispersal of freshwater gastropods [21] for further development of this interesting theme.

The bottom line for this month is that the gastropod populations inhabiting lotic environments move.  Their movement upstream is slow but measurable, while their movement downstream is rapid and episodic.  What are the evolutionary consequences?  Might these two processes be sufficient to maintain panmixia, contrary to King Arthur’s lesson?  Tune in next time.


Notes

[1] For more about this “polymath, and one of Britain’s leading evolutionary biologists,” see:

  • Clarke, B.C. (2008) Arthur James Cain, 25 July 1921 – 20 August 1999.  Biographical Memoirs of Fellows of the Royal Society 54: 47 – 57.

 [2] My favorites from Arthur Cain’s bibliography:

  • Cain, A.J. and P.M. Sheppard (1954) Natural selection in Cepaea.  Genetics 39: 89 – 116.
  • Cain, A.J. and P.M. Sheppard (1954) The theory of adaptive polymorphism.  American Naturalist 88: 321 – 326.
  • Cain, A.J. and P.M. Sheppard (1956) Adaptive and selective value.  American Naturalist 90: 202-203.
  • Cain, A.J. and J.D. Currey (1963) Area effects in Cepaea.  Philosophical Transactions of the Royal Society Series B 246: 1 – 81.

[3] The masterful review of J.S. Jones and colleagues might fairly be said to sum up the entire research corpus of the British school of ecological genetics:

  • Jones, J.S., B.H. Leith, and P. Rawlings (1977) Polymorphism in Cepaea: A problem with too many solutions?  Annual Review of Ecology and Systematics 8: 109 – 143.

[4] No, I did not try to work out the phylogeny of the Pleuroceridae in my dissertation!  That is the LAST thing, not the first thing.  I haven't gotten there yet, and it doesn't look like I ever will.

[5] Bovbjerg, R.V. (1952)  Ecological aspects of dispersal of the snail Campeloma decisum.  Ecology 33: 169 – 176.

[6] OTSIWATFA = Of The Snails I Was Able To Find Again.

[7] Eugene Mancini’s 1978 dissertation was an old-school gem packed with great observations on pleurocerid biology.  I first heard about it from Steve Chambers [7], and in March of 1981 wrote a long letter to Dr. Mancini, then working at Woodward-Clyde Associates in California, to request a copy.  He cordially complied in April.  I was so impressed by the 93 page work that I showed it to my mentor George Davis, at that time editor of Malacologia.  George agreed with me that it should be published, and so I wrote a second letter to Mancini, thanking him for his kindness, complimenting him on his work, and offering a prescription of modest edits by which we felt it could be published in Malacologia.  I never heard from him again.

  • Mancini, E.R. (1978)  The biology of Goniobasis semicarinata (Say) in the Mosquito Creek drainage system, southern Indiana.  Ph.D. Dissertation, University of Louisville.  93 pp.

[8] Steve was an important influence on my young career, and a good friend.   See

  • Fred Thompson, Steve Chambers, and the pleurocerids of Florida [15Feb17]

[9] Crutchfield, P.J. (1966)  Positive rheotaxis in Goniobasis proxima.  Nautilus 79:80 -86.

[10] My favorite references on intrapopulation dispersal in Biomphalaria:

  • Pimentel, D., P.C. White & V. Idelfonso (1957) Vagility of Australorbis glabratus intermediate host of Schistosoma mansoni in Puerto Rico.  Am J Trop Med Hyg 12: 191 – 196.
  • Scorza, J.V., J. Silva, L. Gonzalez, & R. Machado (1961) Stream velocity as a gradient in Australorbis glabratus (Say, 1818).  Zeitschrift fur Tropenmedizin und Parasitologie 12: 191-196.
  • Paulini, E. (1963) Field observation on the upstream migration of Australorbis glabratus.  Bull WHO 29: 838 – 841.
  • Etges, F.J. & L.P. Frick (1966) An experimental field study of chemoreception and response in Australorbis glabratus (Say) under rheotactic conditions.  Am J Trop Med Hyg 15(3):434-438.

[11] Dussart. G.B.J. (1987) Effects of water flow on the detachment of some aquatic pulmonate gastropods.  American Malacological Bulletin 5: 65 – 72.

[12] Marsh. P.C. (1980) An occurrence of high behavioral drift for a stream gastropod.  American Midland Naturalist 104: 410 – 411.

[13] Marsh referred to his study organism as “Physa gyrina,” but I’m sure my readership will agree with me that Physa acuta is a much more likely identification.

[14] Papers documenting freshwater gastropod drift, from Marsh [11]:

  • Dendy, J.S. (1944) The fate of stream animals in stream drift when carried into lakes.  Ecological Monographs 14: 333-357.
  • Logan, S.M. (1963)  Winter observations on bottom organisms and trout in Bridger Creek, Montana.  Trans Am Fish Soc 92: 140 -145.
  • Clifford, H.F. (1972) Drift of invertebrates in an intermittent stream draining marshy terrain of west-central Alberta.  Can J Zool 50: 985 – 991.

[15] Waters, T.F. (1981) Drift of stream invertebrates below a cave source.  Hydrobiologia 78: 169 – 175.

[16] McKillop. W. & A. Harrison (1982)  Hydrobiological studies of eastern Lesser Antillean Islands.  VII. St. Luca: Behavioral drift and other movements of freshwater marsh mollusks.  Archiv fur Hydrobiologie 94: 53 – 69.

[17] You are looking at the only straight patch of road in all of Grayson County, Virginia.  Jim and I spent 24 hours living in a van, parked down by the river at left.  About 3-4:00 PM a good old boy, driving a jacked-up Plymouth, stopped by for a chin-wag.  As he departed, he boasted that he could “get rubber in four gears” across that bridge, in the roughly 300 yards from the store at left to the mountain wall at right.  I’m not sure how he knew he could do it [17], but he did it.

[18] But I’ve got a pretty good hunch.

[19] McKillop & Harrison sampled other months, but the diel periodicity is not as dramatic, primarily because of the confounding effects of rain.  Refer to their paper directly for the entire data set.

[20] Appleton, C.C. & G.M. Branch (1989)  Upstream migration by the invasive snail, Physa acuta, in Cape Town, South Africa.  South African Journal of Science 85: 189 – 190.

[21] The phenomenon of aerial dispersal in freshwater gastropods has been reviewed on four occasions in the long history of this blog:

  • Freshwater gastropods take to the air, 1991 [15Dec16]
  • A previously unrecognized symbiosis? [11Jan17]
  • Accelerating the snail’s pace, 2012 [24Apr17]
  • Freshwater snails and passerine birds [26May17]